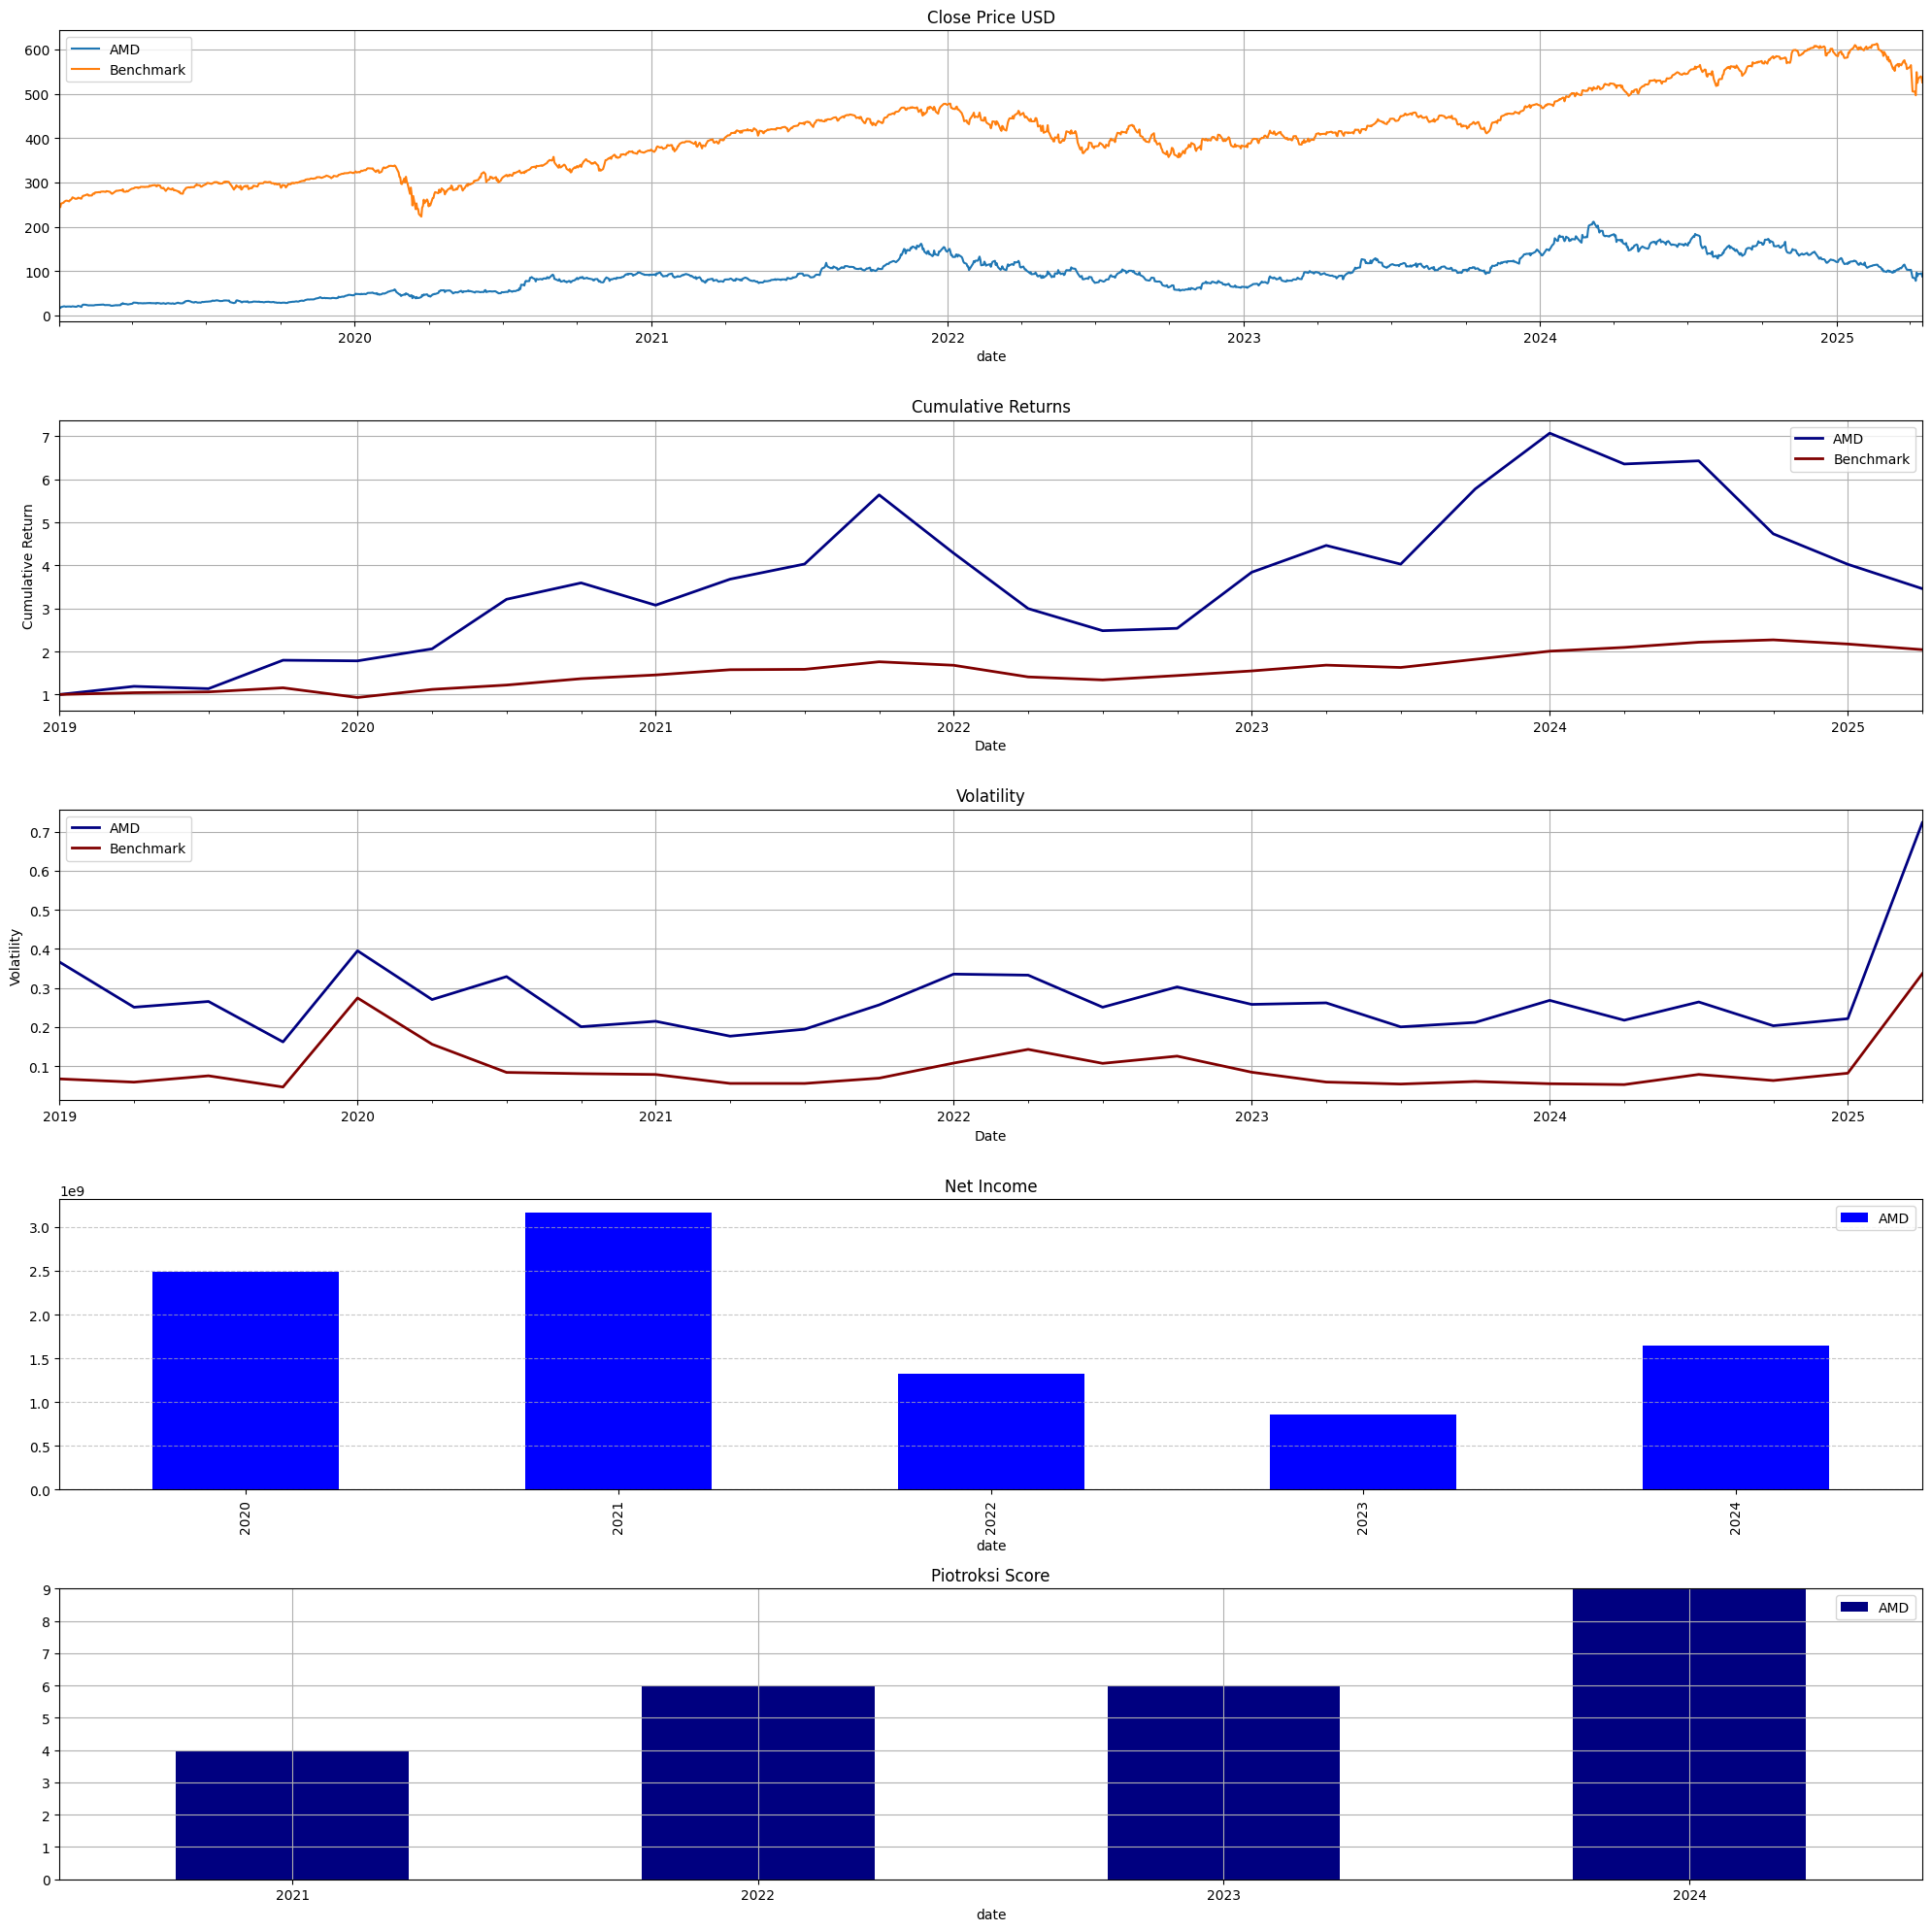
ADVANCED MICRO DEVICES INC (Semiconductors & Related Devices)
Fiscal year end : 1227 Report Date : 2024-12-28 Filing Date : 2025-02-05
ADVANCED MICRO DEVICES, INC.Consolidated Balance Sheets 2024 2023 2022 2021
──────────────────────────────────────────────────────────────────────────────────────────────────────────────
Cash & Equivalents millions 3,787 3,933 4,835 2,535 Accounts Receivable millions 6,192 4,323 4,126 2,706 Inventory millions 5,734 4,351 3,771 1,955 Total Current Assets millions 19,049 16,768 15,019 8,583 Property, Plant and Equipment millions 1,802 1,589 1,513 702 Goodwill millions 24,839 24,262 24,200 289 Other Assets millions 3,146 2,805 2,152 1,478 Total Assets millions 69,226 67,885 67,580 12,419 Accounts Payable millions 1,990 2,055 2,493 1,321 Total Current Liabilities millions 7,281 6,689 6,369 4,240 Long-term Liabilities millions 1,816 1,850 1,664 321 Commitments & Contingencies Common Stock millions 17 17 16 12 Retained Earnings millions 2,364 723( 131)( 1,451) Other Comprehensive Income millions( 69)( 10)( 41)( 3) Total Stockholders' Equity millions 57,568 55,892 54,750 7,497 Total Liabilities & Equity millions 69,226 67,885 67,580 12,419
ADVANCED MICRO DEVICES, INC.Income Statements 2024 2023 2022 2021 2020
──────────────────────────────────────────────────────────────────────────────────────────────────────────────────────────
Revenue millions 25,785 22,680 23,601 16,434 9,763Cost of Sales millions( 13,060)( 12,220)( 12,998) 8,505 5,416Research & Development millions( 6,456)( 5,872)( 5,005)( 2,845)( 1,983)Selling, General & Admin millions( 2,783)( 2,352)( 2,336)( 1,448)( 995)Operating Income millions 1,900 401 1,264 3,648 1,369Income Tax millions( 381)( 346)( 122)( 513)( 1,210)Net Income millions 1,641 854 1,320 3,162 2,490 EPS Basic 1.01 0.53 0.85 2.61 2.1 EPS Diluted 1 0.53 0.84 2.57 2.06 Shares Basic millions 1,620 1,614 1,561 1,213 1,184 Shares Diluted millions 1,637 1,625 1,571 1,229 1,207
ADVANCED MICRO DEVICES, INC.Consolidated Statement of Cash Flows 2024 2023 2022 2021 2020
──────────────────────────────────────────────────────────────────────────────────────────────────────────────────────────
Stock-based Compensation millions 1,407 1,384 1,081 379 274 Inventories millions( 1,458)( 580)( 1,401)( 556)( 417) Net Cash from Operations millions 3,041 1,667 3,565 3,521 1,071 Capital Expenditures millions( 636)( 546)( 450)( 301) Net Cash from Investing millions( 1,101)( 1,423) 1,999 686 Stock Repurchases millions( 862)( 985)( 3,702)( 1,762) Net Cash from Financing millions( 2,062)( 1,146)( 3,264) 1,895Net Change in Cash millions( 122)( 902) 2,300 940Total Cash and Equivalents millions 3,811 3,933 4,835 2,535Available durations for this statement:1 MonthAnnual
Statistics for AMD
Revenue
Net Income
Gross Margin %
Net Margin %
ROE %
ROA %
Loading ITables v2.3.0 from the init_notebook_mode cell...
(need help?)
Insights for AMD
ROE < 5.0%
ROA < 2.0%
Performance Details for AMD
0
Loading ITables v2.3.0 from the init_notebook_mode cell...
(need help?)
Maximum Drawdown for AMD
AMD
Benchmark
Loading ITables v2.3.0 from the init_notebook_mode cell...
(need help?)
ANSS
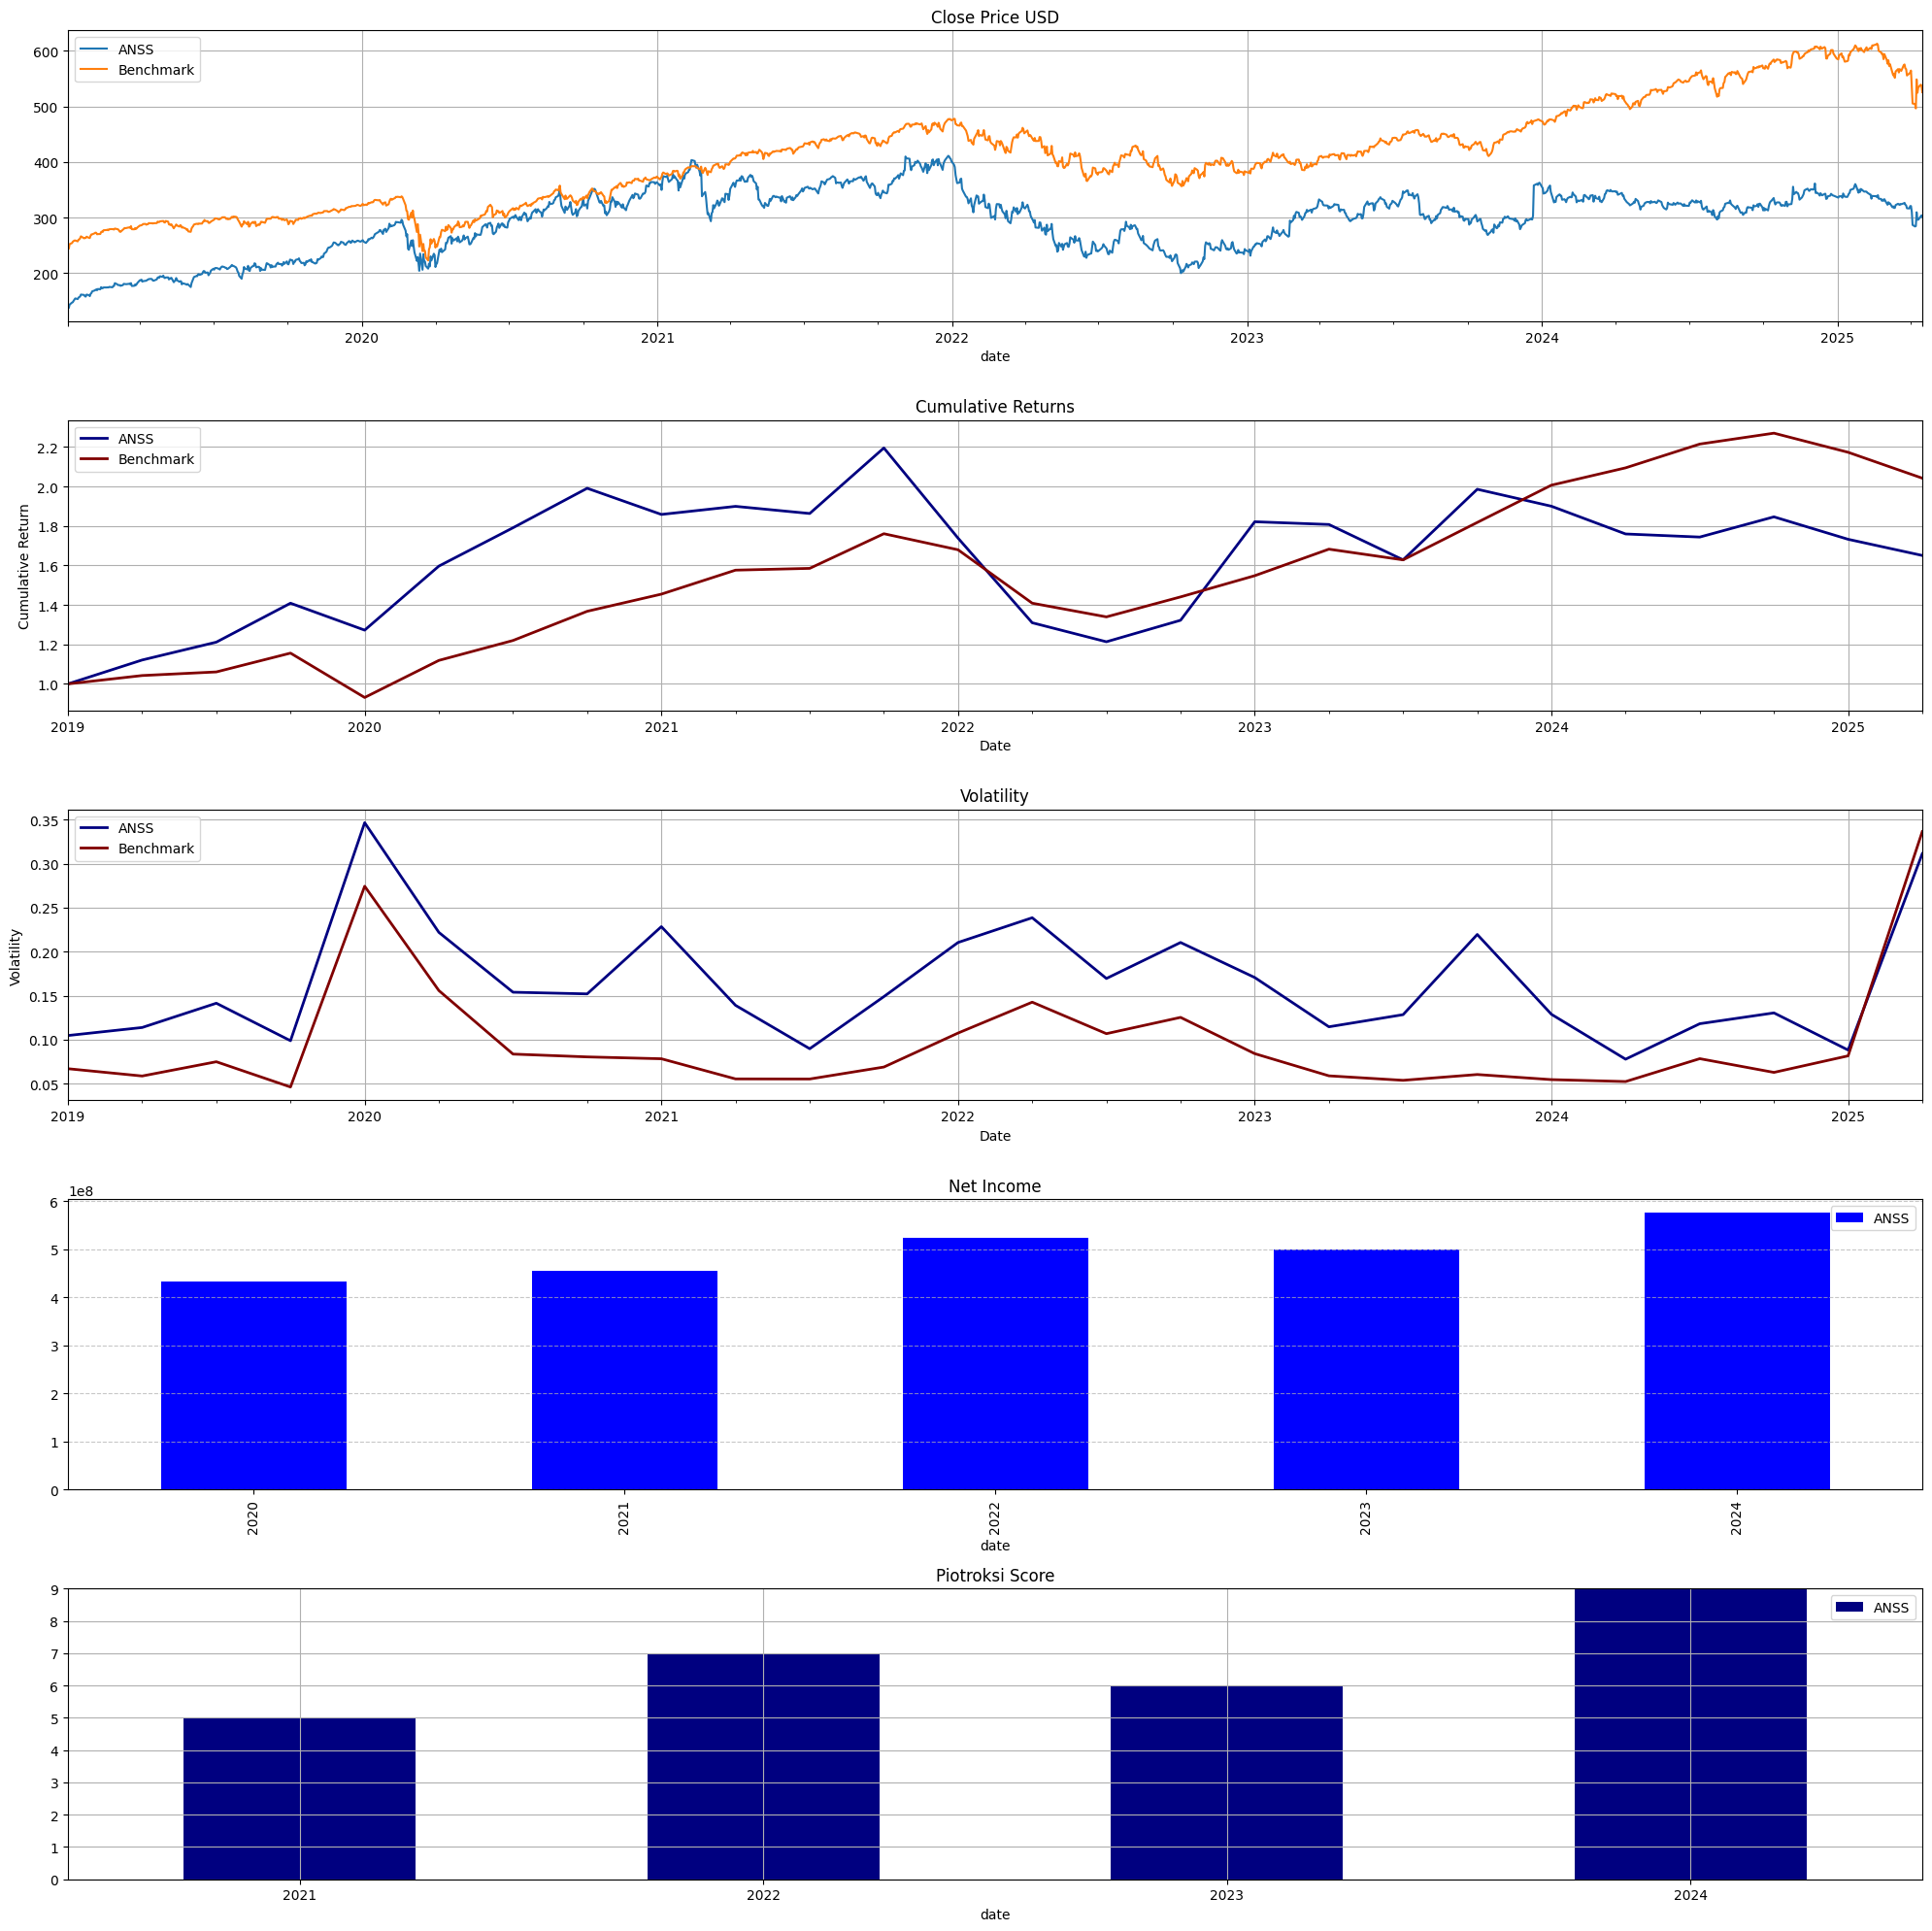
ANSYS INC (Services-Prepackaged Software)
Fiscal year end : 1231 Report Date : 2024-12-31 Filing Date : 2025-02-19
ANSYS, Inc.Consolidated Balance Sheets 2024 2023 2022 2021
───────────────────────────────────────────────────────────────────────────────────────────────────────────────
Accounts Receivable thousands 1,022,850 864,526 760,287 645,891 Total Current Assets thousands 2,831,493 2,049,567 1,664,122 1,638,574 Property, Plant and Equipment thousands 89,646 77,780 80,838 87,914 Goodwill thousands 3,778,128 3,805,874 3,658,267 3,409,271 Other Assets thousands 308,333 273,030 261,880 279,676 Total Assets thousands 8,051,431 7,322,875 6,687,945 6,324,314 Accounts Payable thousands 27,062 22,772 14,021 10,863 Total Current Liabilities thousands 941,184 889,294 794,836 778,492 Long-term Liabilities thousands 126,800 113,520 102,756 98,272 Commitments & Contingencies Common Stock thousands 953 953 953 953 Retained Earnings thousands 5,859,034 5,283,342 4,782,930 4,259,220 Other Comprehensive Income thousands( 147,580)( 90,271)( 122,722)( 56,112) Total Stockholders' Equity thousands 6,086,440 5,390,364 4,865,851 4,484,048 Total Liabilities & Equity thousands 8,051,431 7,322,875 6,687,945 6,324,314
ANSYS, Inc.Income Statements 2024 2023 2022 2021 2020
───────────────────────────────────────────────────────────────────────────────────────────────────────────────────────────────
Cost of Sales thousands ( 279,819) ( 271,298) ( 250,641) ( 257,984)( 225,264) Selling, General & Admin thousands 995,340 855,135 772,871 715,377 587,707 Research & Development thousands 528,014 494,869 433,661 404,870 355,371 Total Operating Expenses thousands(1,547,102)(1,372,516)(1,222,254)(1,135,460)( 959,677)Operating Income thousands 717,888 626,135 592,658 513,271 496,356Pre-tax Income thousands 718,038 592,138 575,315 515,354 493,925Income Tax thousands ( 142,346) ( 91,726) ( 51,605) ( 60,727)( 60,038)Net Income thousands 575,692 500,412 523,710 454,627 433,887
ANSYS, Inc.Consolidated Statement of Cash Flows 2024 2023 2022 2021 2020
───────────────────────────────────────────────────────────────────────────────────────────────────────────────────────────
Stock-based Compensation thousands 270,900 221,891 168,128 166,338 145,615 Net Cash from Operations thousands 795,740 717,122 631,003 549,482 547,310 Net Cash from Investing thousands( 99,562)( 240,042)( 411,368)( 536,813)( 614,253) Stock Repurchases -0( 1,965)( 2,056)( 1,347)( 1,610) Net Cash from Financing thousands( 98,544)( 231,319)( 245,508)( 245,852) 96,597Net Change in Cash thousands 586,542 245,810( 53,276)( 245,005) 40,578Total Cash and Equivalents thousands 1,446,743 860,201 614,391 667,667 912,672
Statistics for ANSS
Revenue
Net Income
Gross Margin %
Net Margin %
ROE %
ROA %
Loading ITables v2.3.0 from the init_notebook_mode cell...
(need help?)
Performance Details for ANSS
1
Loading ITables v2.3.0 from the init_notebook_mode cell...
(need help?)
Maximum Drawdown for ANSS
ANSS
Benchmark
Loading ITables v2.3.0 from the init_notebook_mode cell...
(need help?)
BKR
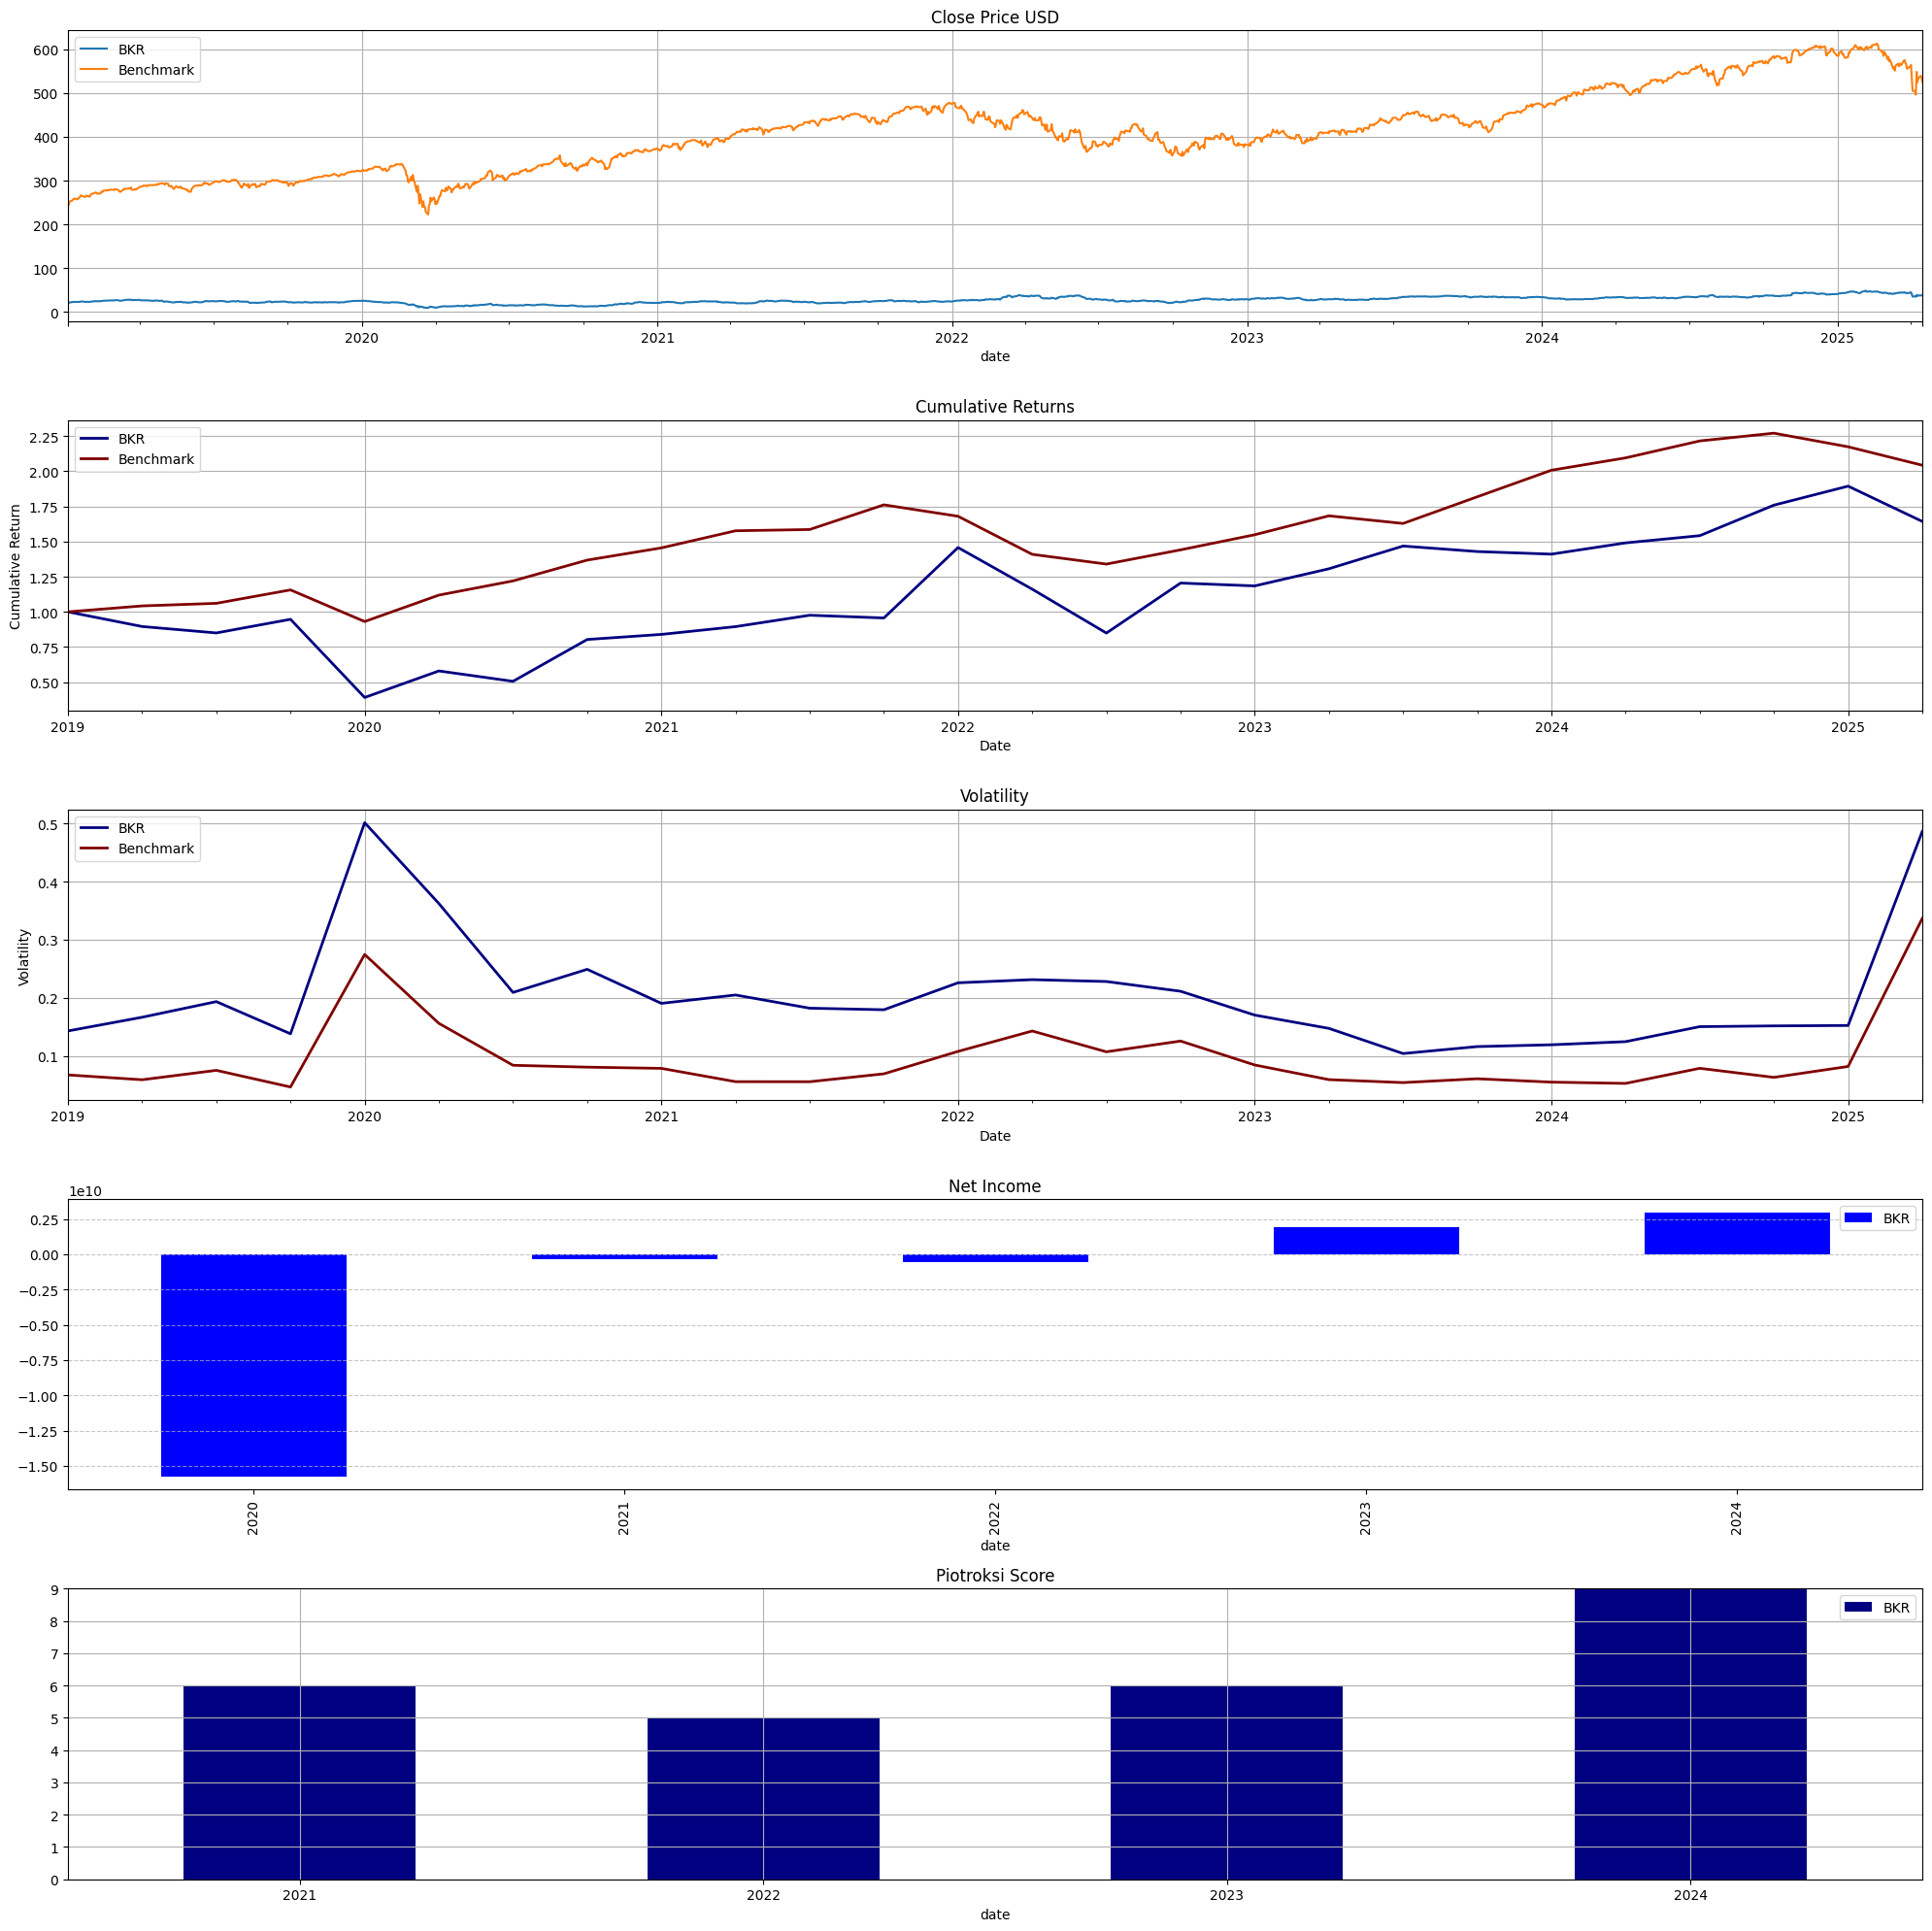
Baker Hughes Co (Oil & Gas Field Machinery & Equipment)
Fiscal year end : 1231 Report Date : 2024-12-31 Filing Date : 2025-02-04
Baker Hughes CompanyConsolidated Balance Sheets 2024 2023 2022 2021
──────────────────────────────────────────────────────────────────────────────────────────────────────────────
Inventory millions 4,954 5,094 4,587 3,979 Total Current Assets millions 17,211 16,301 14,592 15,065 Property, Plant and Equipment millions 5,127 4,893 4,538 4,877 Goodwill millions 6,078 6,137 5,930 5,959 Other Assets millions 2,982 3,043 2,781 2,943 Total Assets millions 38,363 36,945 34,181 35,308 Accounts Payable millions 4,542 4,471 4,298 3,745 Total Current Liabilities millions 12,991 12,991 11,075 9,128 Long-term Liabilities millions 1,276 1,409 1,412 1,510 Common Stock millions 0 0 Retained Earnings millions( 5,840)( 8,819)( 10,761)( 10,160) Other Comprehensive Income millions( 3,161)( 2,796)( 2,971)( 2,385) Total Stockholders' Equity millions 16,895 15,368 14,394 14,830 Total Liabilities & Equity millions 38,363 36,945 34,181 35,308
Baker Hughes CompanyIncome Statements 2024 2023 2022 2021 2020
──────────────────────────────────────────────────────────────────────────────────────────────────────────────────────────
Revenue millions 27,829 25,506 21,156 20,502 20,705 Cost of Sales Selling, General & Admin millions 2,458 2,611 2,510 2,470 2,404Operating Income millions 3,081 2,317 1,185 1,310( 15,978)Pre-tax Income millions 3,265 2,655 22 428( 15,202)Income Tax millions( 257)( 685)( 600)( 758)( 559)Net Income millions 2,979 1,943( 601)( 219)( 9,940) EPS Basic 3 1.93( 0.61)( 0.27) EPS Diluted 2.98 1.91( 0.61)( 0.27)( 14.73)
Baker Hughes CompanyConsolidated Statement of Cash Flows 2024 2023 2022 2021 2020
──────────────────────────────────────────────────────────────────────────────────────────────────────────────────────────
Stock-based Compensation millions 202 197 207 205 210 Inventories millions( 102)( 461)( 885)( 170)( 80) Net Cash from Operations millions 3,332 3,062 1,888 2,374 1,304 Net Cash from Investing millions( 1,016)( 817)( 1,564)( 463)( 618) Stock Repurchases millions( 484)( 538)( 828)( 434) -0 Net Cash from Financing millions( 1,527)( 2,028)( 1,592)( 2,143) 225Net Change in Cash millions 718 158( 1,365)( 279) 883Total Cash and Equivalents millions 3,364 2,646 2,488 3,853 4,132
Statistics for BKR
Revenue
Net Income
Gross Margin %
Net Margin %
ROE %
ROA %
Loading ITables v2.3.0 from the init_notebook_mode cell...
(need help?)
Loading ITables v2.3.0 from the init_notebook_mode cell...
(need help?)
Maximum Drawdown for BKR
BKR
Benchmark
Loading ITables v2.3.0 from the init_notebook_mode cell...
(need help?)
GOOGL
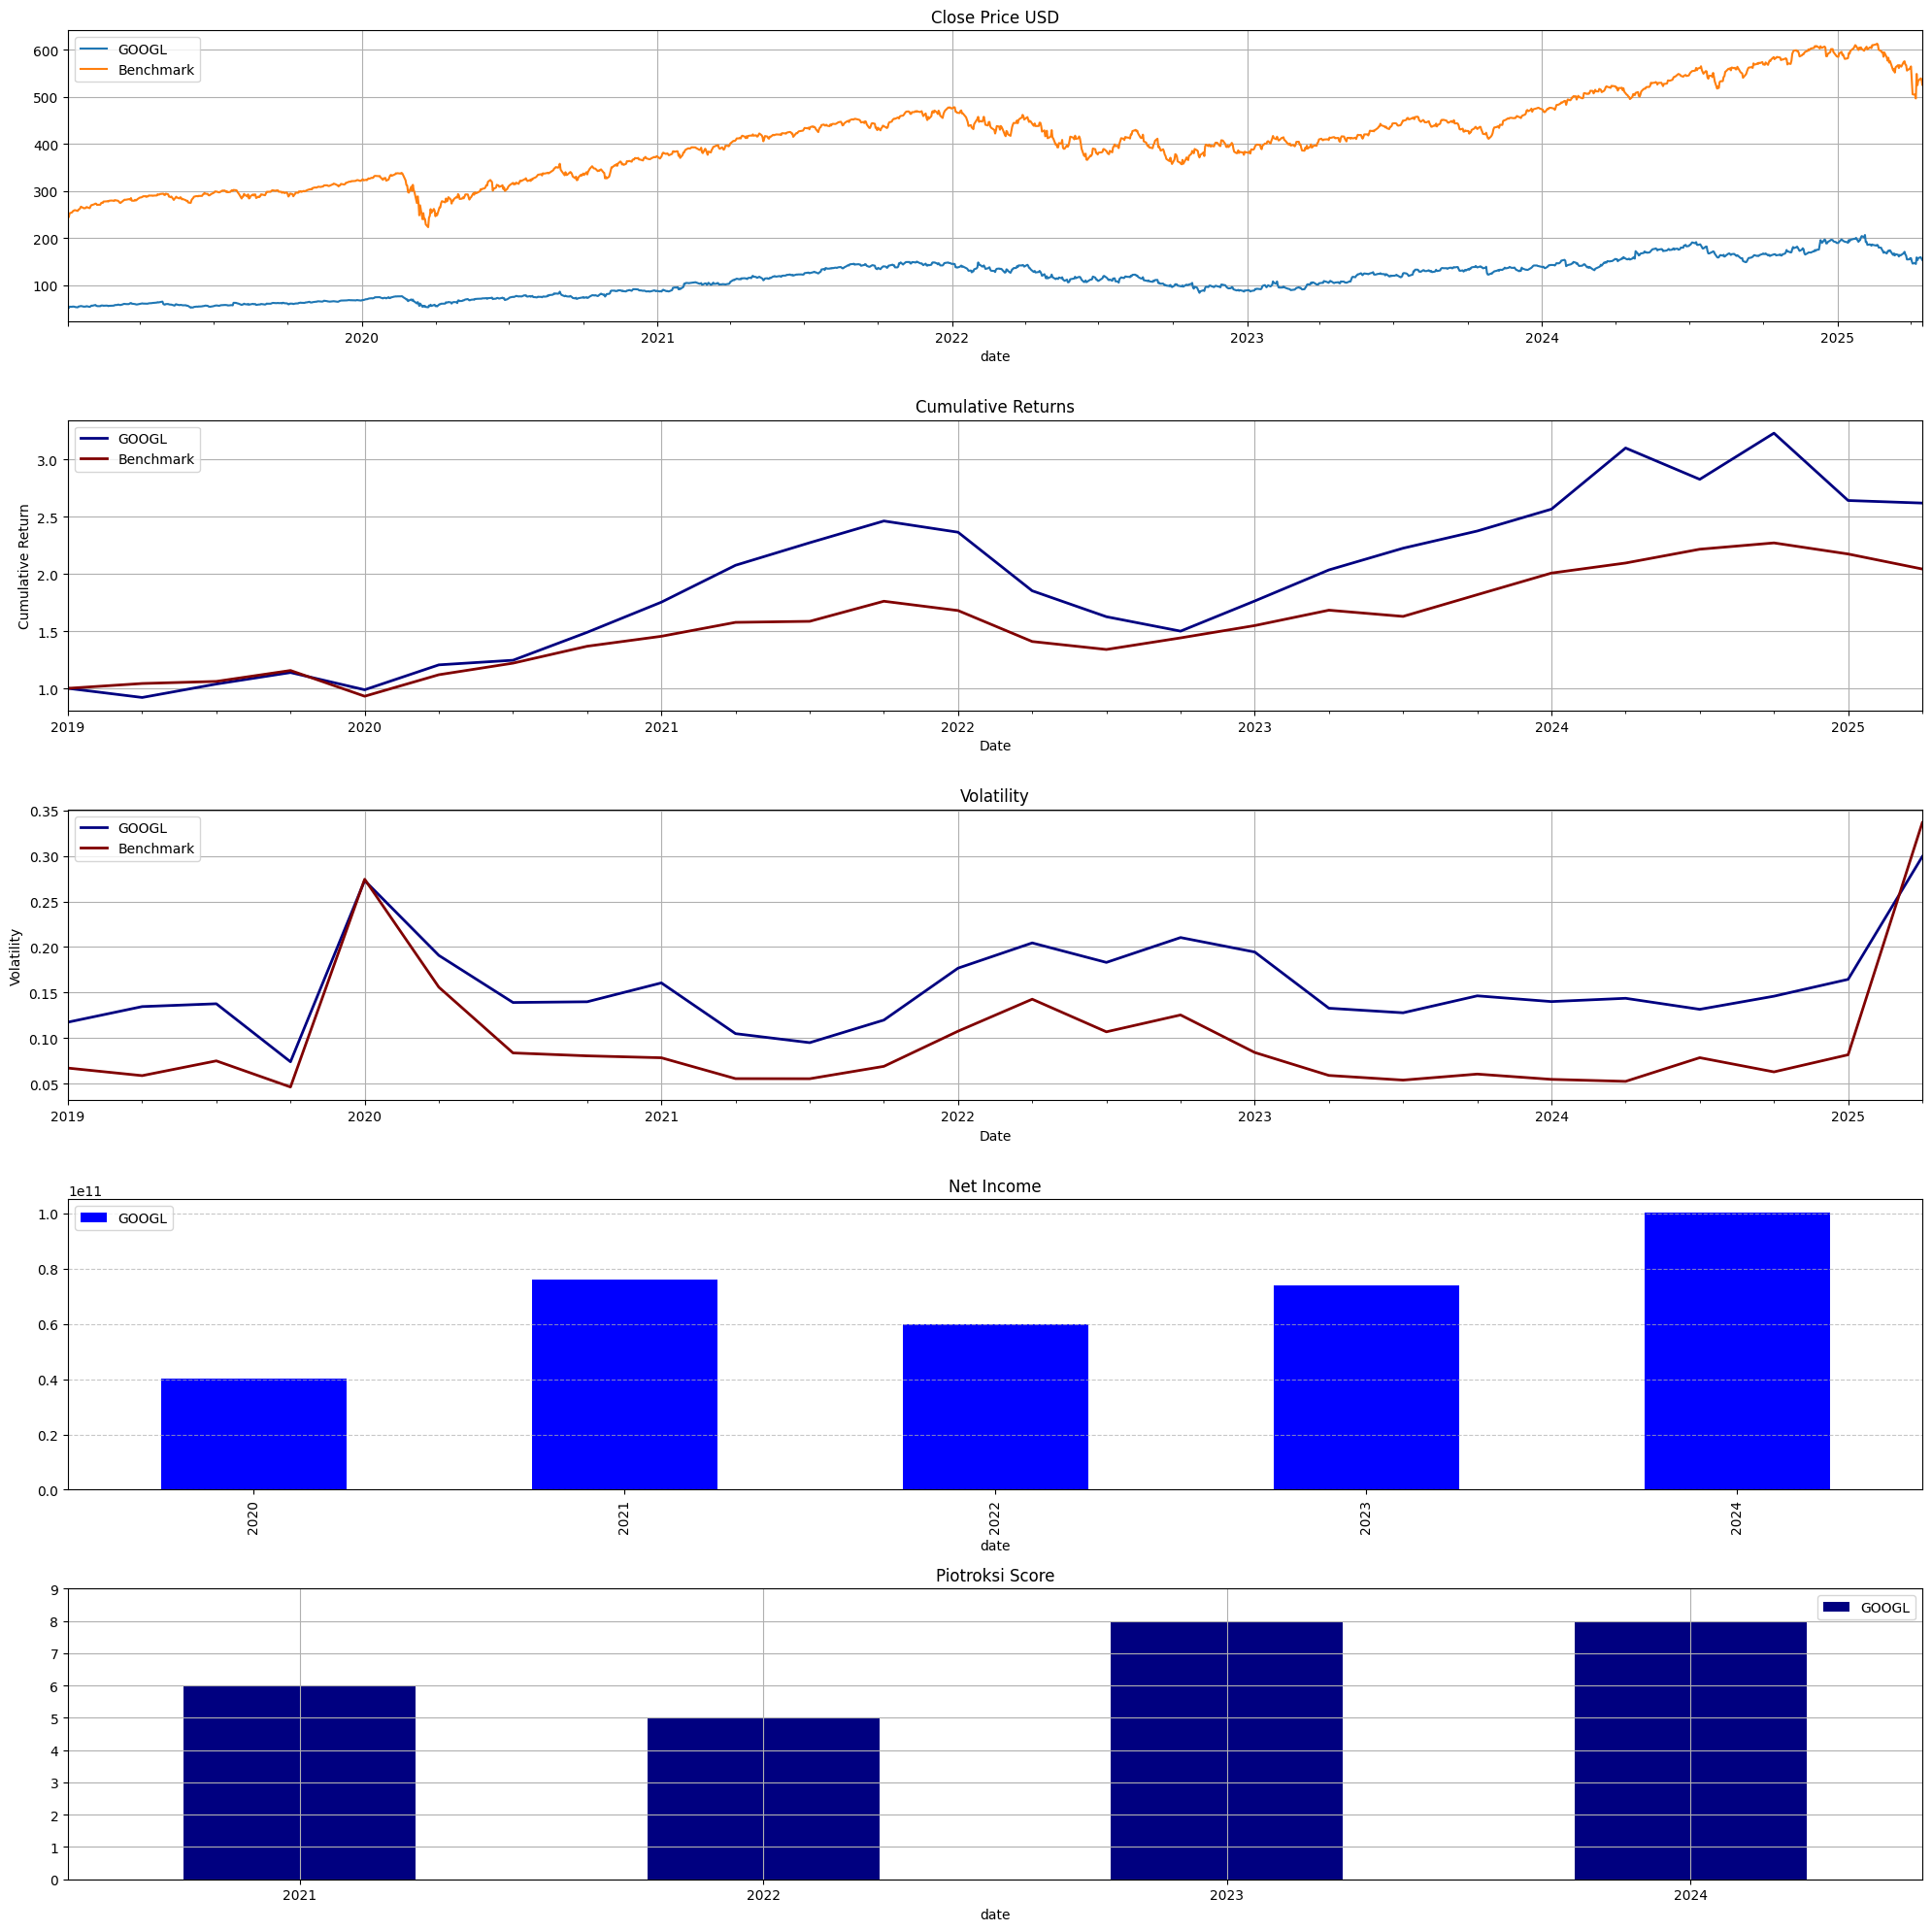
Alphabet Inc. (Services-Computer Programming, Data Processing, Etc.)
Fiscal year end : 1231 Report Date : 2024-12-31 Filing Date : 2025-02-05
Alphabet Inc.Consolidated Balance Sheets 2024 2023 2022 2021
──────────────────────────────────────────────────────────────────────────────────────────────────────────────
Cash & Equivalents millions 23,466 24,048 21,879 20,945 Accounts Receivable millions 52,340 47,964 40,258 39,304 Total Current Assets millions 163,711 171,530 164,795 188,143 Property, Plant and Equipment millions 171,036 134,345 112,668 97,599 Goodwill millions 31,885 29,198 28,960 22,956 Other Assets millions 14,874 10,051 8,707 5,361 Total Assets millions 450,256 402,392 365,264 359,268 Accounts Payable millions 7,987 7,493 5,128 6,037 Total Current Liabilities millions 89,122 81,814 69,300 64,254 Long-term Liabilities millions 4,694 4,395 2,247 2,205 Total Liabilities millions 125,172 119,013 109,120 107,633 Commitments & Contingencies Other Comprehensive Income millions( 4,800)( 4,402)( 7,603)( 1,623) Retained Earnings millions 245,084 211,247 195,563 191,484 Total Stockholders' Equity millions 325,084 283,379 256,144 251,635 Total Liabilities & Equity millions 450,256 402,392 365,264 359,268 Inventory millions 2,670 1,170
Alphabet Inc.Income Statements 2024 2023 2022 2021 2020
──────────────────────────────────────────────────────────────────────────────────────────────────────────────────────────
Revenue millions 350,018 307,394 282,836 257,637 182,527 Research & Development millions 49,326 45,427 39,500 31,562 27,573Operating Income millions 112,390 84,293 74,842 78,714 41,224Pre-tax Income millions 119,815 85,717 71,328 90,734 48,082Income Tax millions( 19,697)( 11,922)( 11,356)( 14,701)( 7,813)Net Income millions 100,118 73,795 59,972 76,033 40,269EPS Basic 8.13 5.84 4.59 5.69 2.96EPS Diluted 8.04 5.8 4.56 5.61 2.93
Alphabet Inc.Consolidated Statement of Cash Flows 2024 2023 2022 2021 2020
──────────────────────────────────────────────────────────────────────────────────────────────────────────────────────────
Stock-based Compensation millions 22,785 22,460 19,362 15,376 12,991 Net Cash from Operations millions 125,299 101,746 91,495 91,652 65,124 Capital Expenditures millions( 52,535)( 32,251)( 31,485)( 24,640)( 22,281) Net Cash from Investing millions( 45,536)( 27,063)( 20,298)( 35,523)( 32,773) Stock Repurchases millions( 62,222)( 61,504)( 59,296)( 50,274)( 31,149) Net Cash from Financing millions( 79,733)( 72,093)( 69,757)( 61,362)( 24,408)Net Change in Cash millions( 582) 2,169 934( 5,520) 7,967Total Cash and Equivalents millions 23,466 24,048 21,879 20,945 26,465
Statistics for GOOGL
Revenue
Net Income
Gross Margin %
Net Margin %
ROE %
ROA %
Loading ITables v2.3.0 from the init_notebook_mode cell...
(need help?)
Performance Details for GOOGL
3
Loading ITables v2.3.0 from the init_notebook_mode cell...
(need help?)
Maximum Drawdown for GOOGL
GOOGL
Benchmark
Loading ITables v2.3.0 from the init_notebook_mode cell...
(need help?)
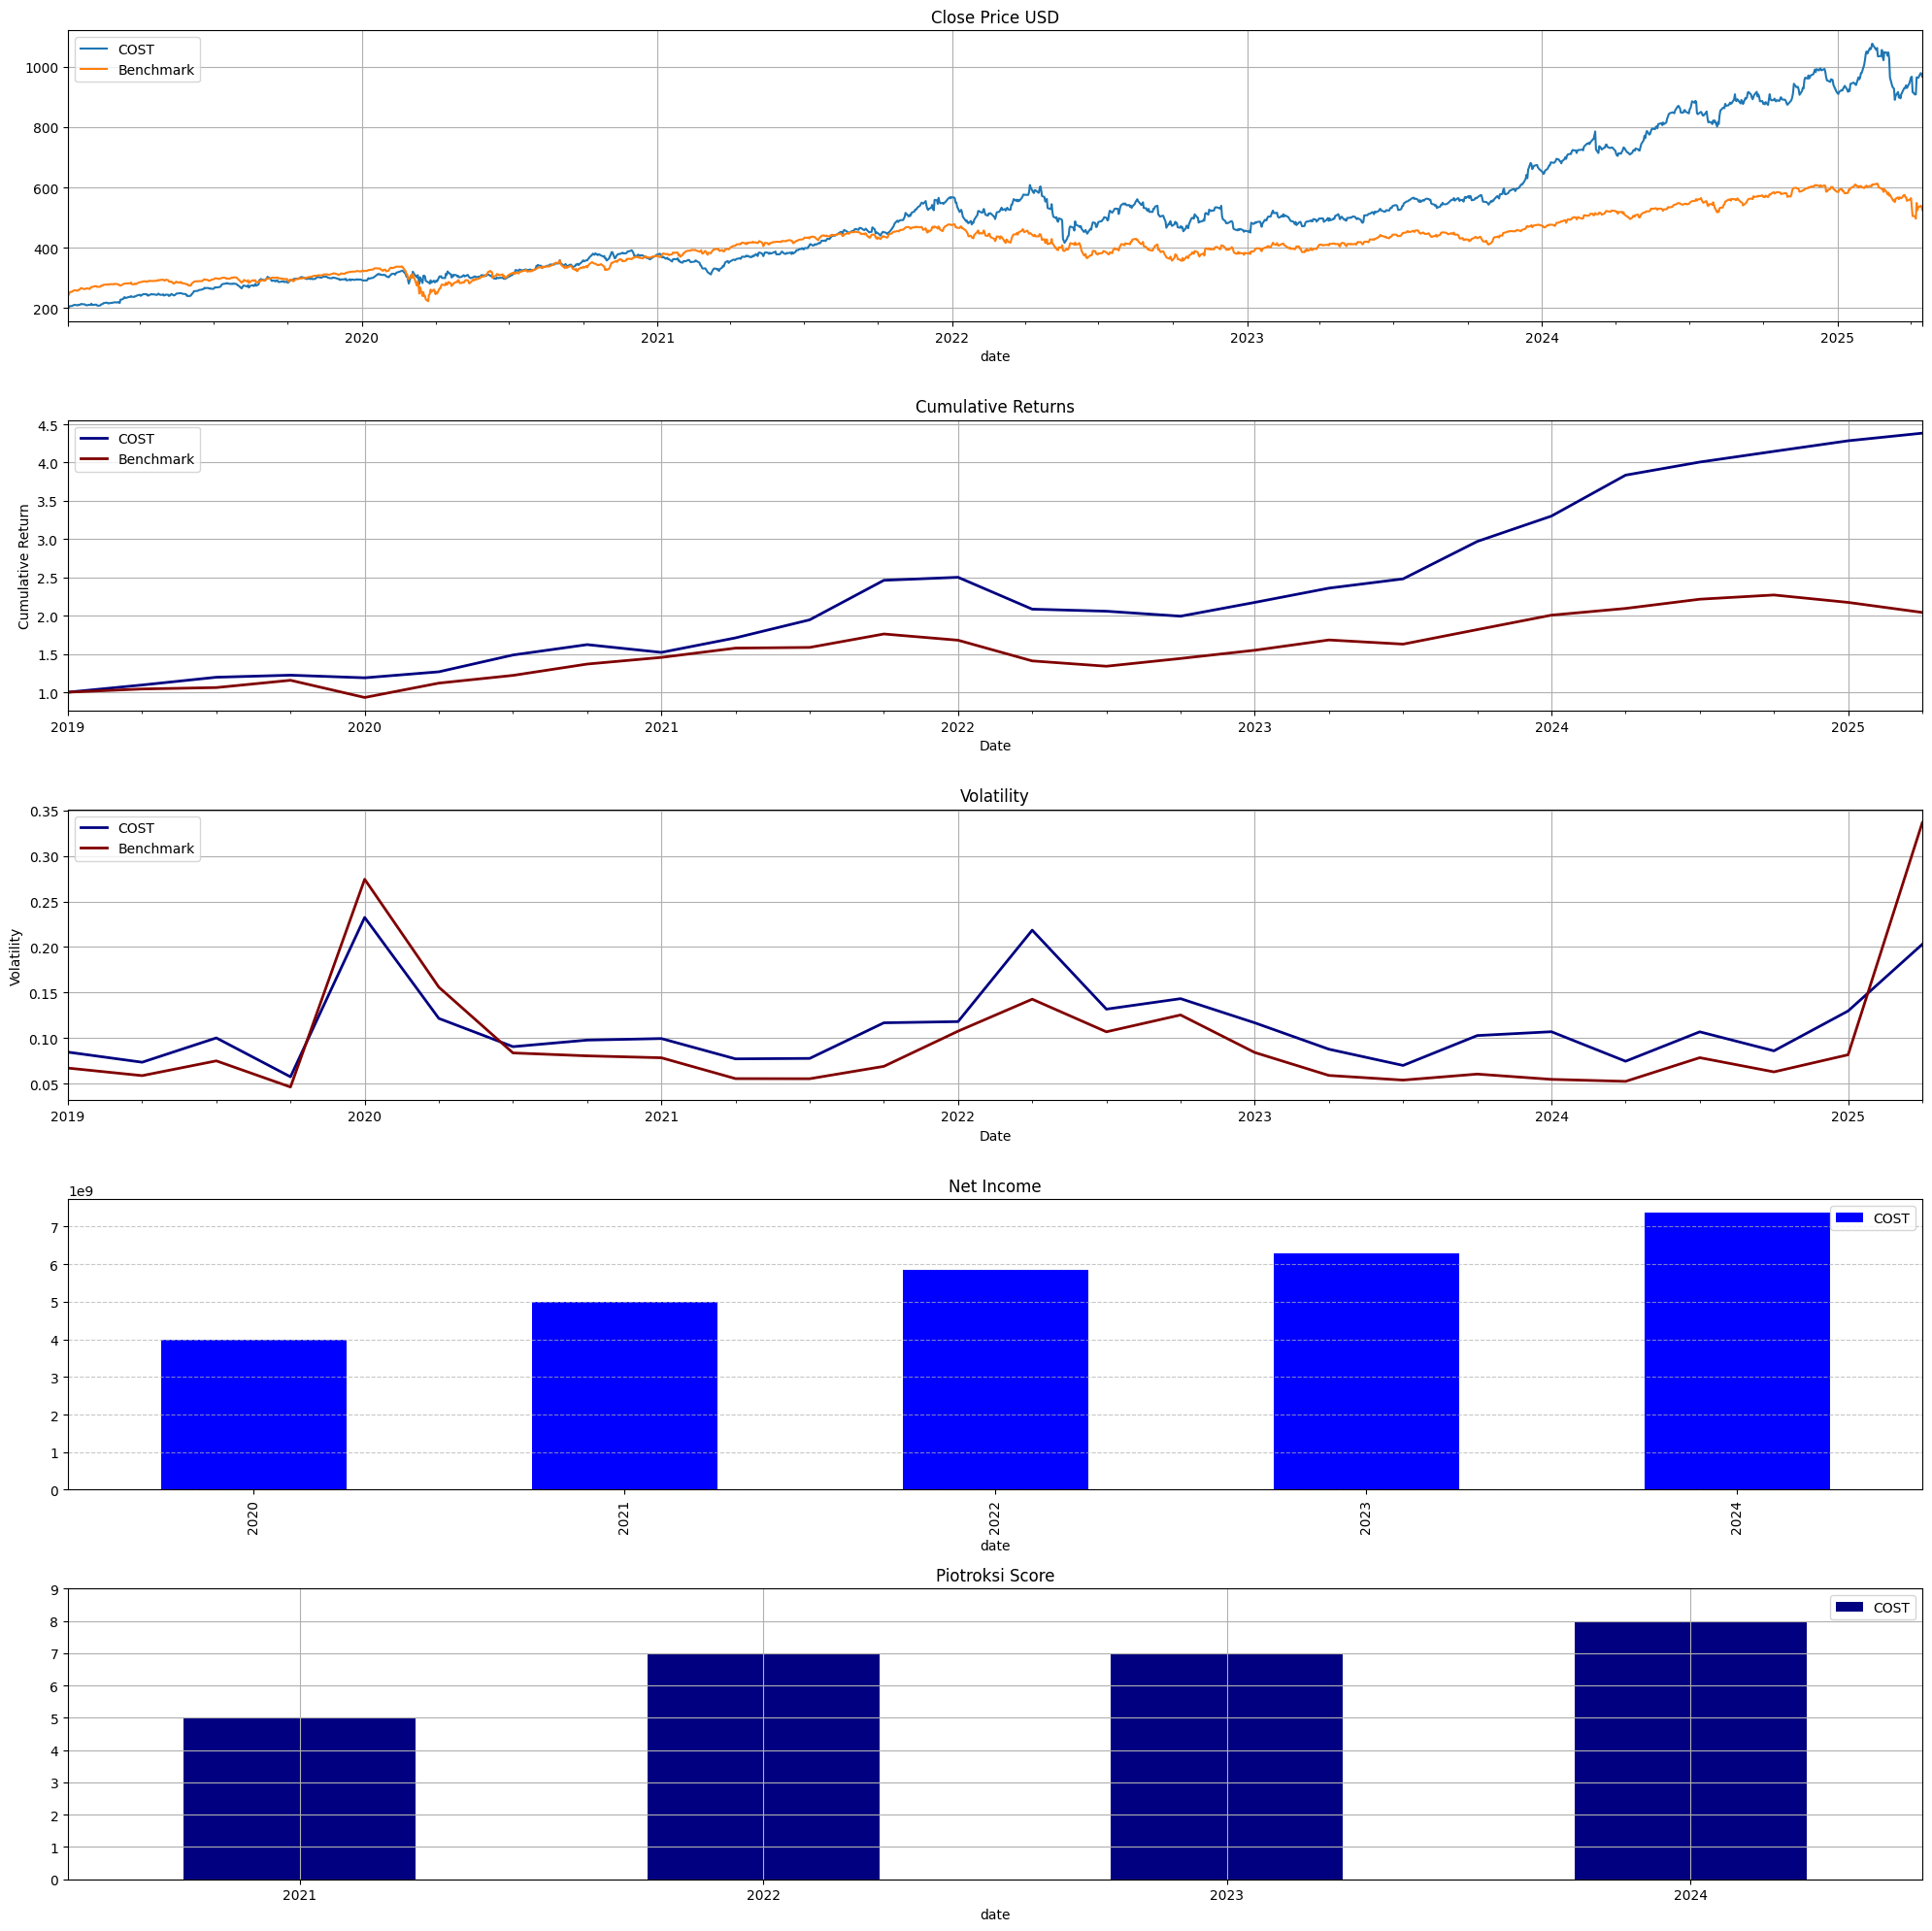
COST
COSTCO WHOLESALE CORP /NEW (Retail-Variety Stores)
Fiscal year end : 0831 Report Date : 2024-09-01 Filing Date : 2024-10-09
COSTCO WHOLESALE CORP /NEWConsolidated Balance Sheets 2024 2023 2022 2021
──────────────────────────────────────────────────────────────────────────────────────────────────────────────
Cash & Equivalents millions 9,906 13,700 10,203 11,258 Inventory millions 18,647 16,651 17,907 14,215 Total Current Assets millions 34,246 35,879 32,696 29,505 Property, Plant and Equipment millions 29,032 26,684 24,646 23,492 Other Assets millions 3,936 3,718 4,050 3,381 Total Assets millions 69,831 68,994 64,166 59,268 Accounts Payable millions 19,421 17,483 17,848 16,278 Total Current Liabilities millions 35,464 33,583 31,998 29,441 Long-term Liabilities millions 2,576 2,550 2,555 2,415 Total Liabilities millions 46,209 43,936 43,519 41,190 Common Stock millions 2 2 2 4 Other Comprehensive Income millions( 1,828)( 1,805)( 1,829)( 1,137) Retained Earnings millions 17,619 19,521 15,585 11,666 Total Stockholders' Equity millions 23,622 25,058 20,642 17,564 Total Liabilities & Equity millions 69,831 68,994 64,166 59,268
COSTCO WHOLESALE CORP /NEWIncome Statements 2024 2023 2022 2021 2020
──────────────────────────────────────────────────────────────────────────────────────────────────────────────────────────
Revenue millions 254,453 242,290 226,954 195,929 166,761 Cost of Sales millions( 222,358)( 212,586)( 199,382)( 170,684)( 144,939) Selling, General & Admin millions( 22,810)( 21,590)( 19,779)( 18,537)( 16,387)Operating Income millions 9,285 8,114 7,793 6,708 5,435Pre-tax Income millions 9,740 8,487 7,840 6,680 5,367Income Tax millions( 2,373)( 2,195)( 1,925)( 1,601)( 1,308)Net Income millions 7,367 6,292 5,844 5,007 4,002
COSTCO WHOLESALE CORP /NEWConsolidated Statement of Cash Flowspresentation_orderindex 2024 2023 2022 2021
─────────────────────────────────────────────────────────────────────────────────────────────────────────────────────────────────────────
Stock-based Compensation millions 818 774 724 665 Inventories millions( 2,068)( 1,228)( 4,003)( 1,892) Net Cash from Operations millions 11,339 11,068 7,392 8,958 Capital Expenditures millions( 4,710)( 4,323)( 3,891)( 3,588) Net Cash from Investing millions( 4,409)( 4,972)( 3,915)( 3,535) Stock Repurchases millions( 700)( 676)( 439)( 496) Net Cash from Financing millions( 10,764)( 2,614)( 4,283)( 6,488)Net Change in Cash millions( 3,794) 3,497( 1,055)( 1,019)Total Cash and Equivalents millions 9,906 13,700 10,203 11,258
Statistics for COST
Revenue
Net Income
Gross Margin %
Net Margin %
ROE %
ROA %
Loading ITables v2.3.0 from the init_notebook_mode cell...
(need help?)
Performance Details for COST
4
Loading ITables v2.3.0 from the init_notebook_mode cell...
(need help?)
Maximum Drawdown for COST
COST
Benchmark
Loading ITables v2.3.0 from the init_notebook_mode cell...
(need help?)
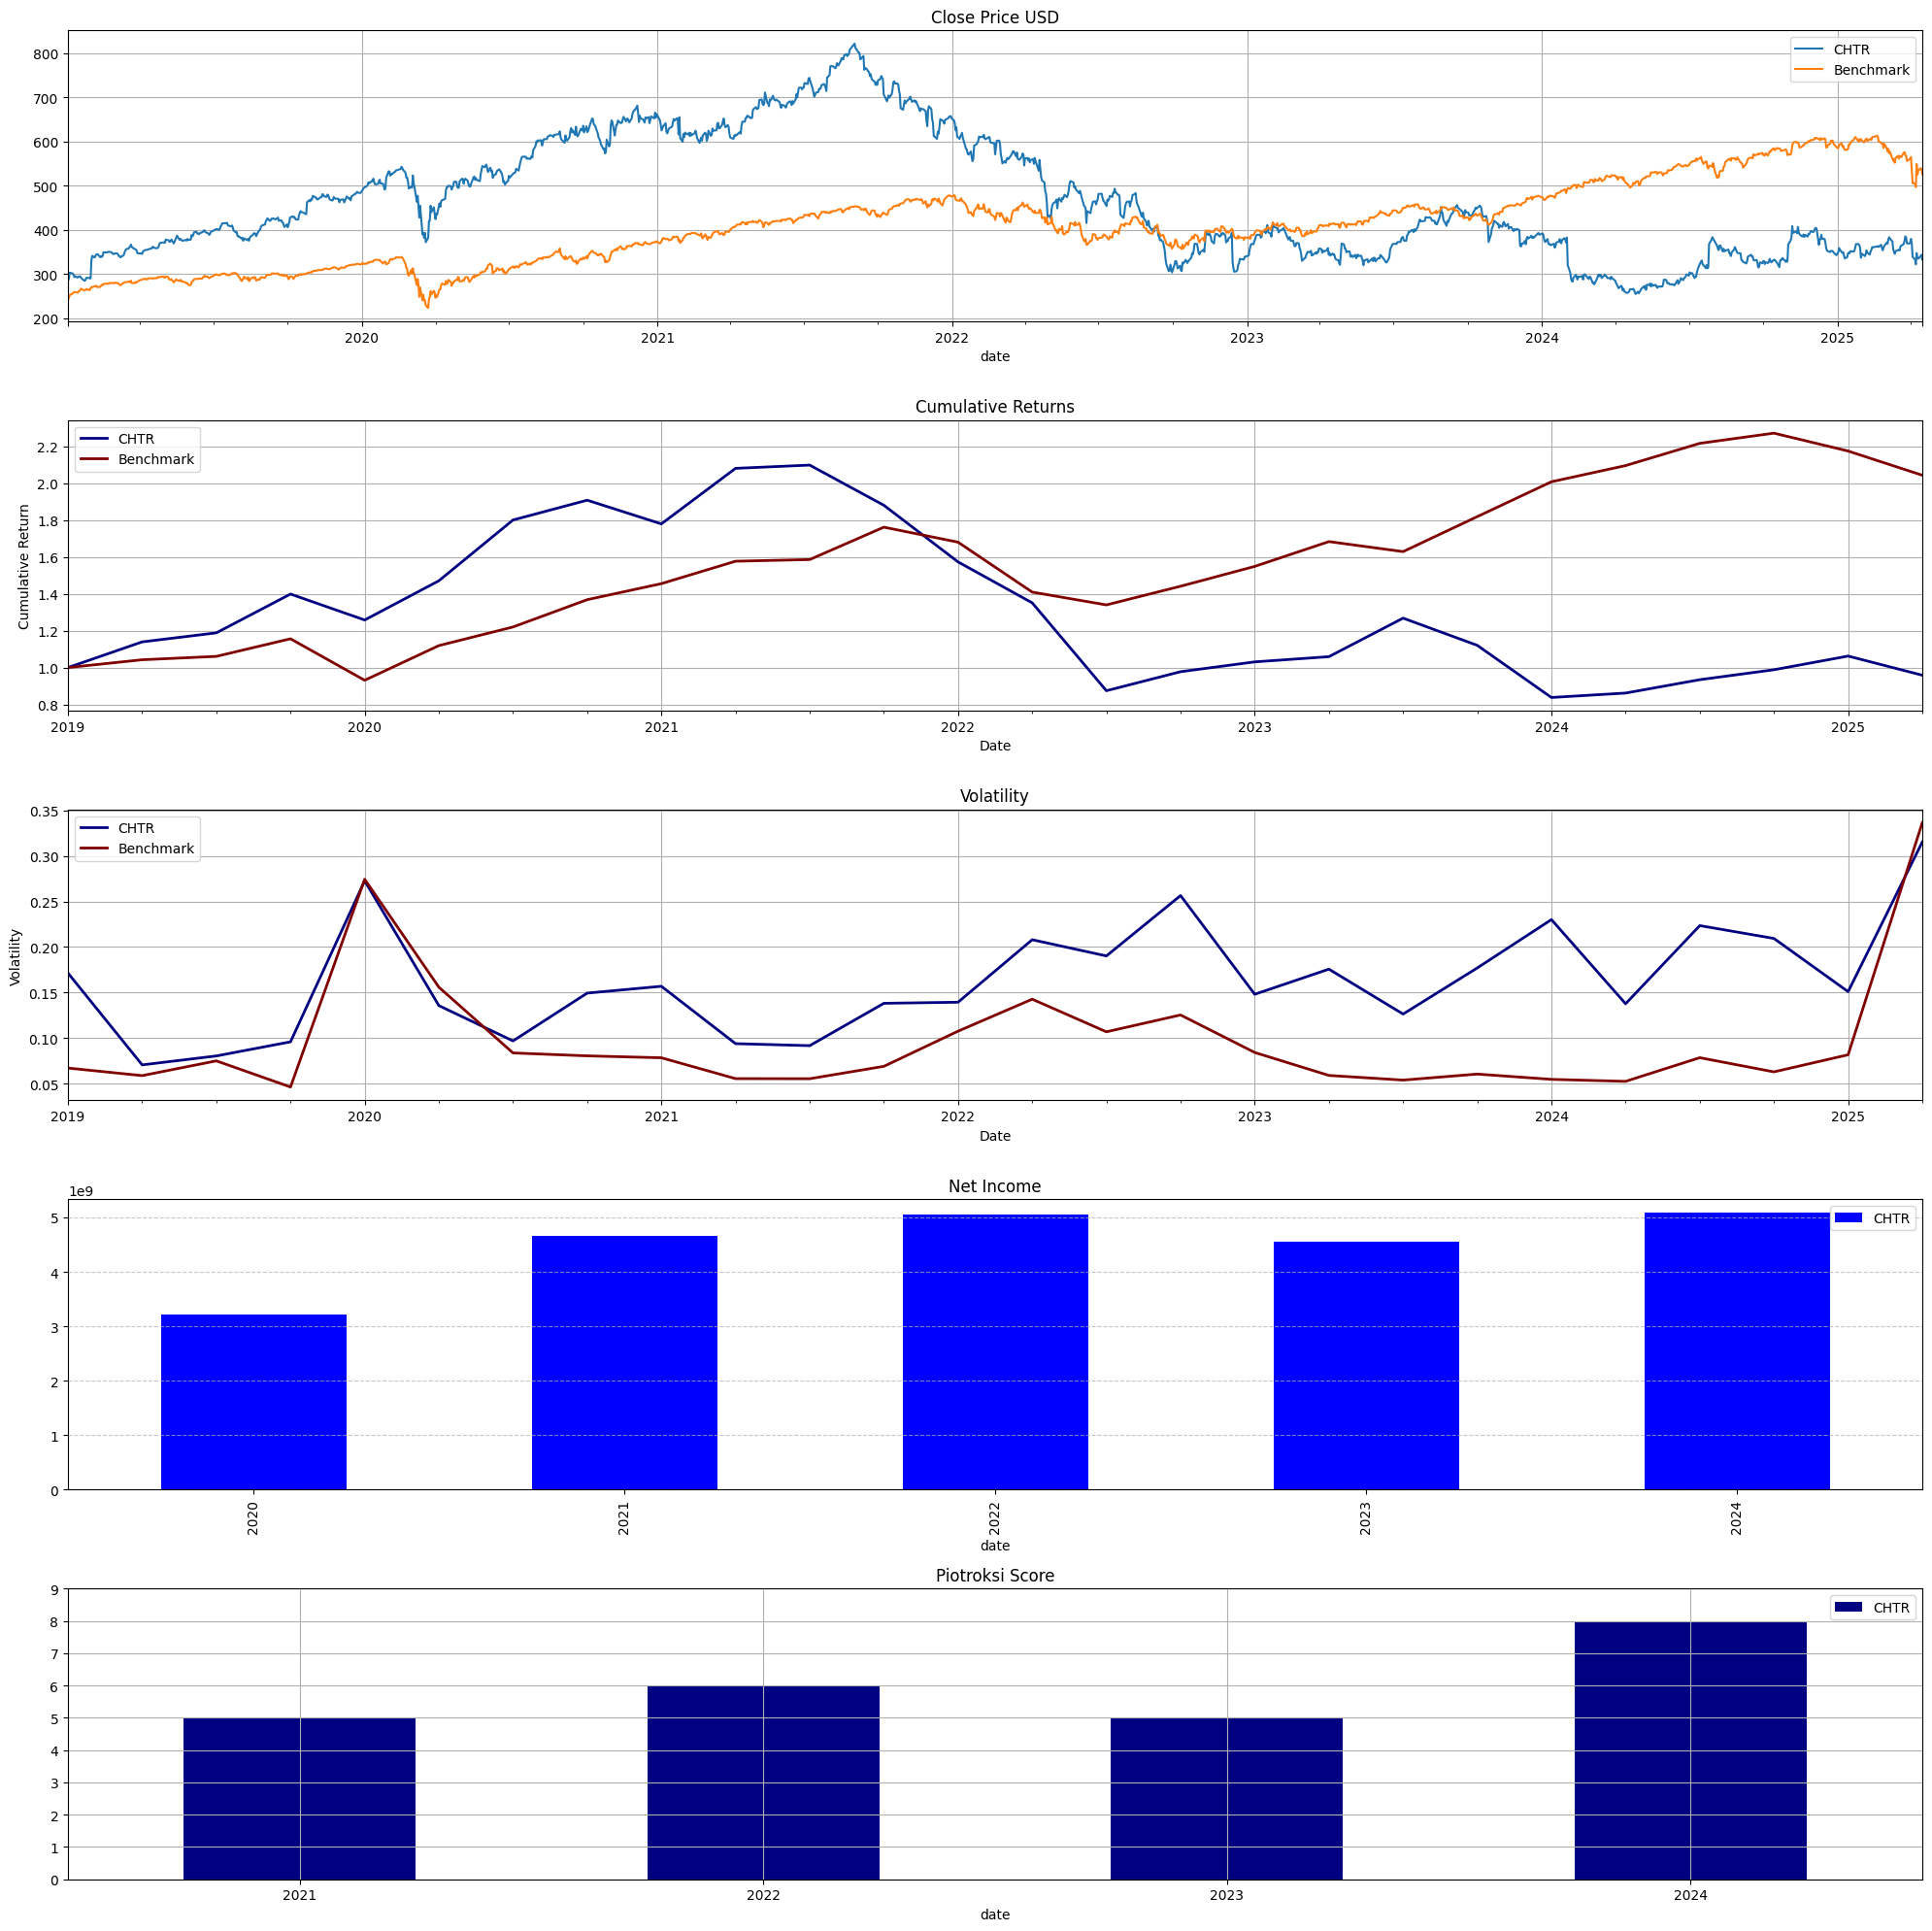
CHTR
CHARTER COMMUNICATIONS, INC. /MO/ (Cable & Other Pay Television Services)
Fiscal year end : 1231 Report Date : 2024-12-31 Filing Date : 2025-01-31
Charter Communications, Inc.Consolidated Balance Sheets 2024 2023 2022 2021
──────────────────────────────────────────────────────────────────────────────────────────────────────────────
Cash & Equivalents millions 459 709 645 601 Accounts Receivable millions 3,097 2,965 2,921 2,579 Total Current Assets millions 4,233 4,132 4,017 3,566 Property, Plant and Equipment millions 42,913 39,520 36,039 34,310 Goodwill millions 29,674 29,668 29,563 29,562 Other Assets millions 4,763 4,732 4,769 3,647 Total Assets millions 150,020 147,193 144,523 142,491 Total Current Liabilities millions 13,486 13,214 12,065 12,458 Long-term Liabilities millions 4,776 4,530 4,758 4,217 Common Stock millions 0 0 0 Retained Earnings millions( 7,750)( 12,260)( 14,821)( 12,675) Total Stockholders' Equity millions 15,587 11,086 9,119 14,050 Total Liabilities & Equity millions 150,020 147,193 144,523 142,491
Charter Communications, Inc.Income Statements 2024 2023 2022 2021 2020
───────────────────────────────────────────────────────────────────────────────────────────────────────────────────────────────
Total Operating Expenses millions 33,167 33,405 32,876 31,482 29,930 Operating Income millions 13,118 12,559 11,962 10,526 8,405Pre-tax Income millions 7,502 6,854 7,462 6,388 4,302Income Tax millions ( 1,649) ( 1,593) ( 1,613) ( 1,068) ( 626)Net Income millions 5,083 4,557 5,055 4,654 3,222 EPS Basic 35.53 30.54 31.3 25.34 15.85 EPS Diluted 34.97 29.99 30.74 24.47 15.4 Shares Basic 143,061,337149,208,188161,501,355183,669,369203,316,483 Shares Diluted 145,363,771151,966,313164,433,596193,042,948209,273,247
Charter Communications, Inc.Consolidated Statement of Cash Flows 2024 2023 2022 2021 2020
──────────────────────────────────────────────────────────────────────────────────────────────────────────────────────────
Stock-based Compensation millions 651 692 470 430 351 Net Cash from Operations millions 14,430 14,433 14,925 16,239 14,562 Capital Expenditures millions( 11,269)( 11,115)( 9,376)( 7,635)( 7,415) Net Cash from Investing millions( 10,654)( 11,127)( 9,114)( 7,754)( 8,157) Stock Repurchases millions( 1,213)( 3,215)( 10,277)( 15,431)( 11,217) Net Cash from Financing millions( 3,979)( 3,242)( 5,767)( 8,885)( 8,953)Net Change in Cash millions( 203) 64 44( 400)( 2,548)Total Cash and Equivalents millions 506 709 645 601 1,001
Statistics for CHTR
Revenue
Net Income
Gross Margin %
Net Margin %
ROE %
ROA %
Loading ITables v2.3.0 from the init_notebook_mode cell...
(need help?)
Insights for CHTR
Debt-to-Equity above 3.0 (high leverage)
Performance Details for CHTR
5
Loading ITables v2.3.0 from the init_notebook_mode cell...
(need help?)
Maximum Drawdown for CHTR
CHTR
Benchmark
Loading ITables v2.3.0 from the init_notebook_mode cell...
(need help?)
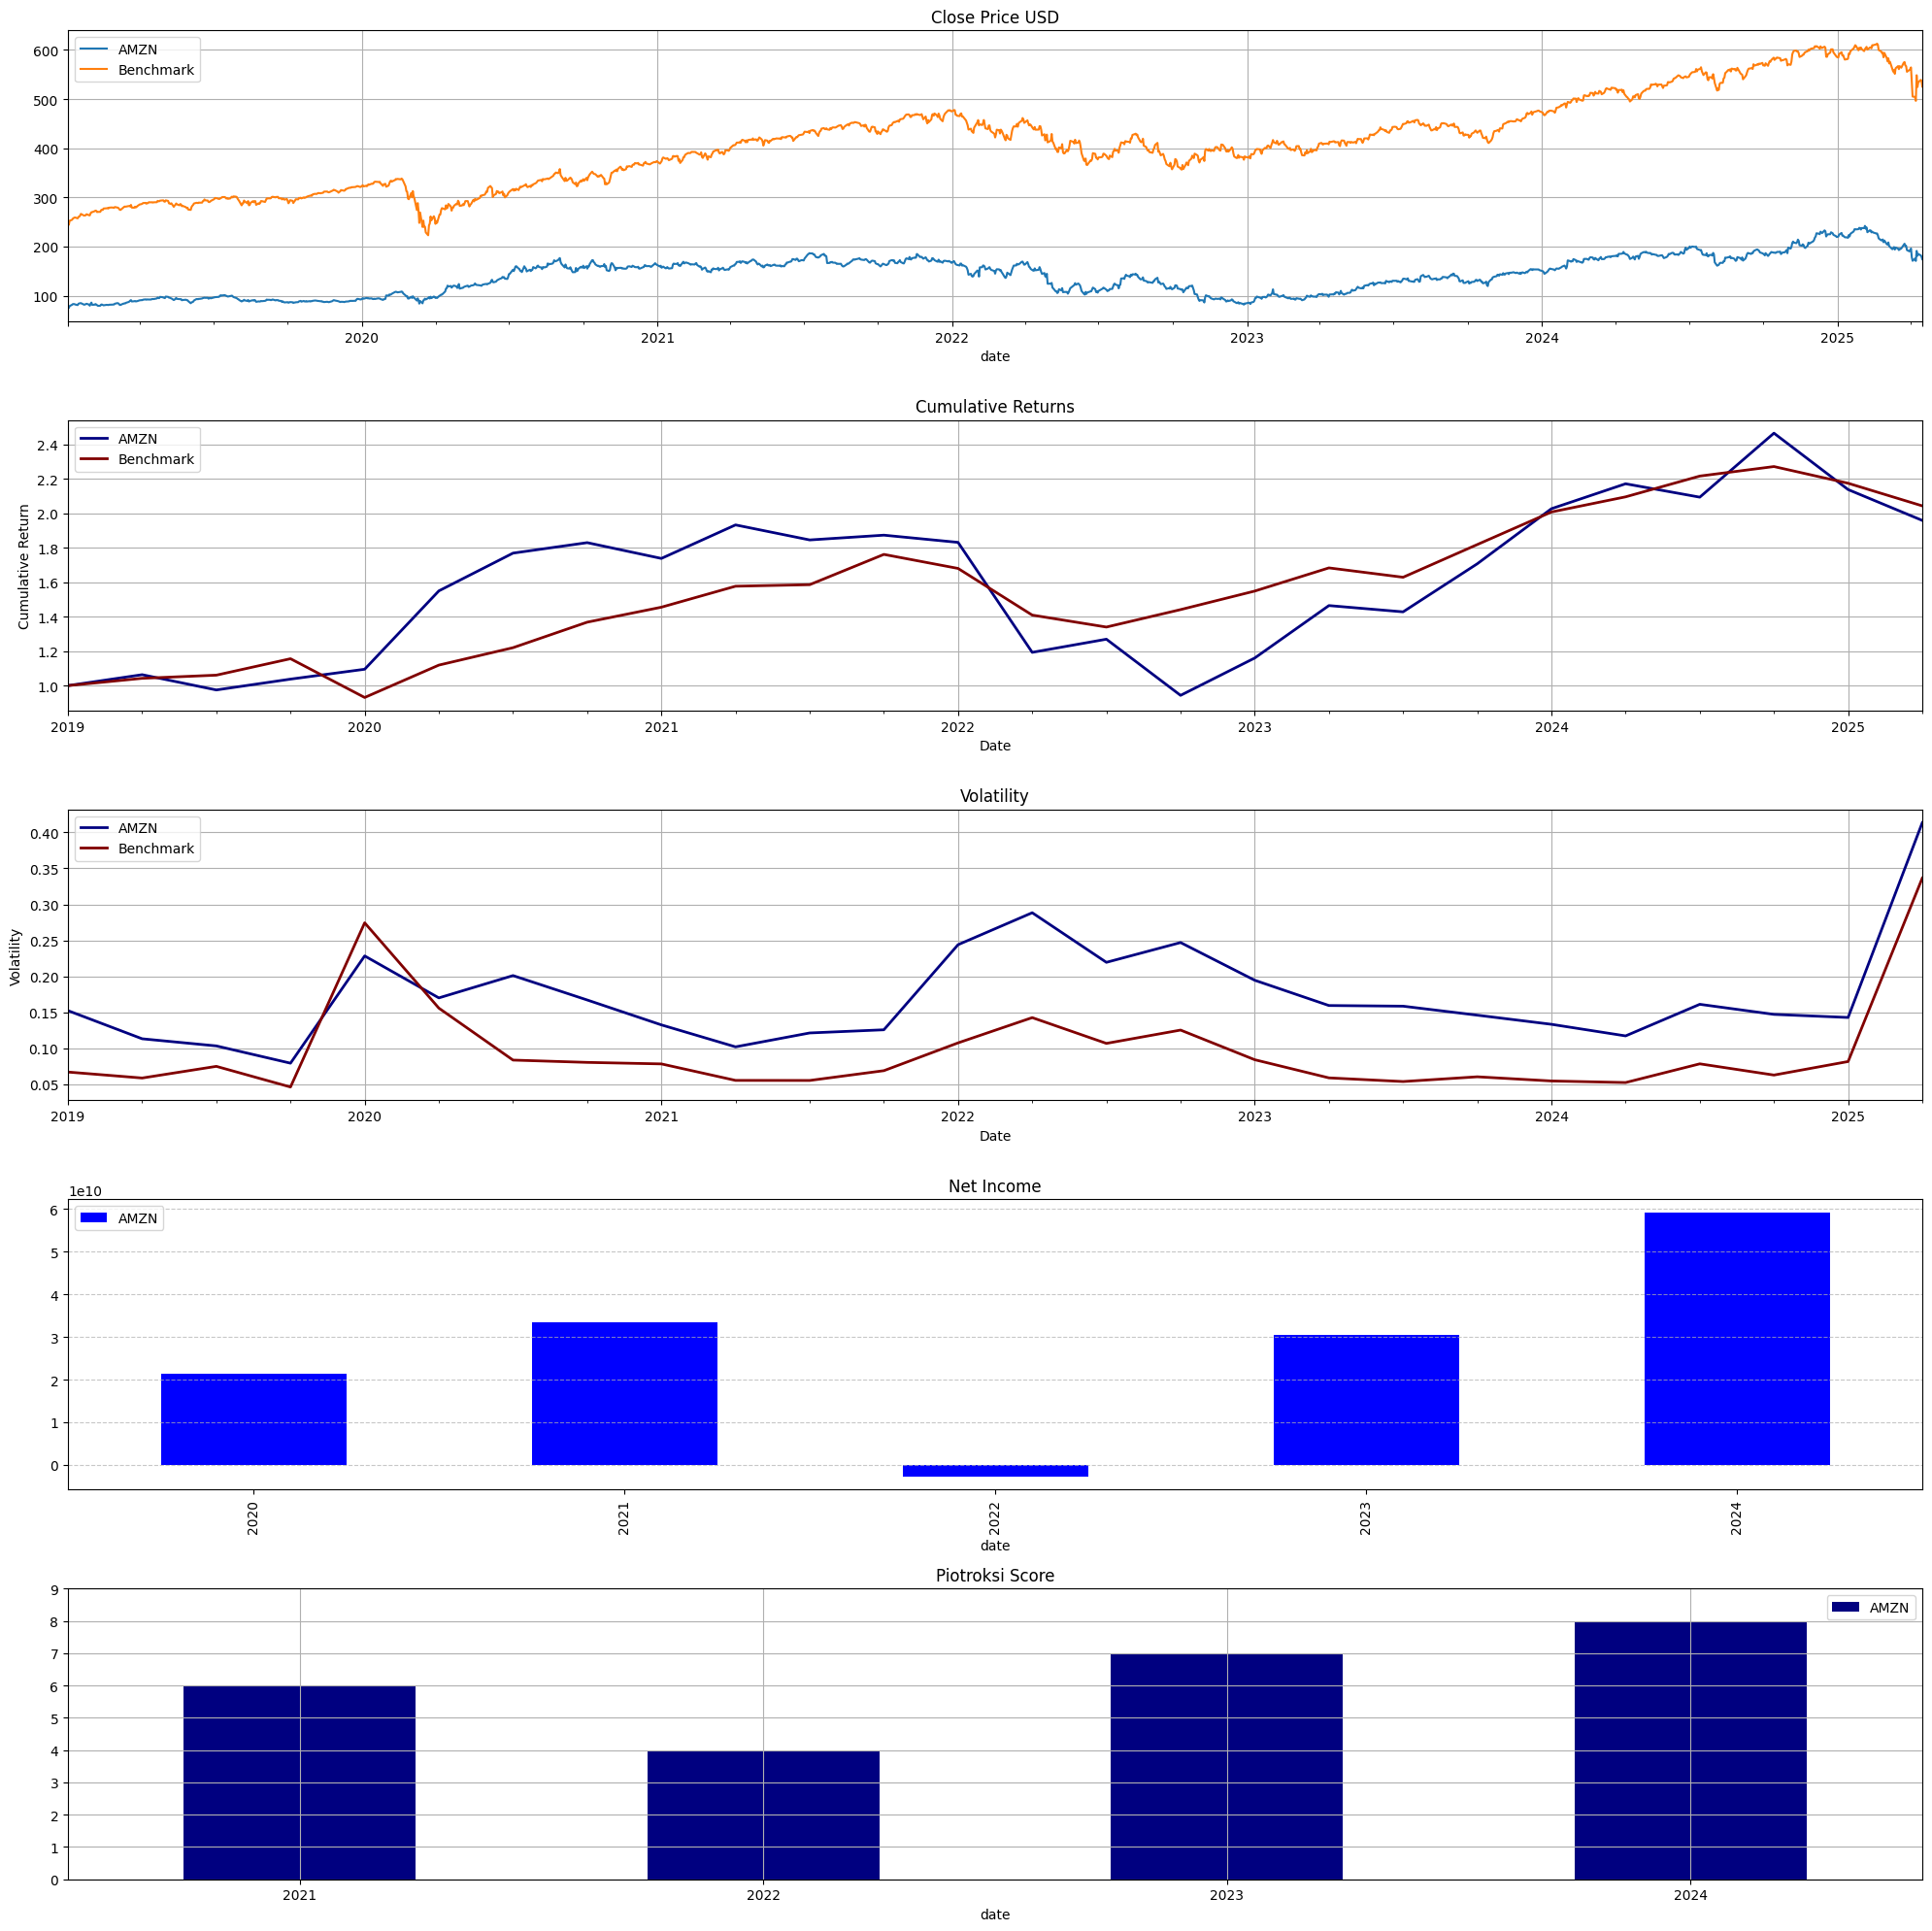
AMZN
AMAZON COM INC (Retail-Catalog & Mail-Order Houses)
Fiscal year end : 1231 Report Date : 2024-12-31 Filing Date : 2025-02-07
AMAZON.COM, INC.Consolidated Balance Sheets 2024 2023 2022 2021 2020
────────────────────────────────────────────────────────────────────────────────────────────────────────────────────────
Cash & Equivalents millions 78,779 73,387 53,888 36,220 Inventory millions 34,214 33,318 34,405 32,640 Accounts Receivable millions 55,451 52,253 42,360 32,891 Total Current Assets millions 190,867 172,351 146,791 161,580 Goodwill millions 23,074 22,789 20,288 15,371 15,017 Other Assets millions 82,147 56,024 42,758 27,235 Total Assets millions 624,894 527,854 462,675 420,549 321,195 Accounts Payable millions 94,363 84,981 79,600 78,664 Total Current Liabilities millions 179,431 164,917 155,393 142,266 Long-term Liabilities millions 28,593 25,451 21,121 23,643 Commitments & Contingencies Common Stock millions 111 109 108 106 Other Comprehensive Income millions( 34)( 3,040)( 4,487)( 1,376) Retained Earnings millions 172,866 113,618 83,193 85,915 Total Stockholders' Equity millions 285,970 201,875 146,043 138,245 93,404 Total Liabilities & Equity millions 624,894 527,854 462,675 420,549
AMAZON.COM, INC.Income Statements 2024 2023 2022 2021 2020
──────────────────────────────────────────────────────────────────────────────────────────────────────────────────────────
Revenue millions 637,959 574,785 513,983 228,035 386,064 Cost of Sales millions 326,288 304,739 288,831 272,344 233,307Operating Income millions 68,593 36,852 12,248 24,879 22,899Income Tax ( 93)( 71)( 32)( 48)( 29)Net Income millions 59,248 30,425( 2,722) 33,364 21,331EPS Basic 5.66 2.95( 0.27) 3.3 2.13EPS Diluted 5.53 2.9( 0.27) 3.24 2.09 Shares Basic millions 10,473 10,304 10,189 10,117 10,005 Shares Diluted millions 10,721 10,492 10,189 10,296 10,198
AMAZON.COM, INC.Consolidated Statement of Cash Flows 2024 2023 2022 2021 2020
──────────────────────────────────────────────────────────────────────────────────────────────────────────────────────────
Total Cash and Equivalents millions 82,312 73,890 54,253 36,477 42,377 Stock-based Compensation millions 22,011 24,023 19,621 12,757 9,208 Inventories millions( 1,884)( 1,449)( 2,592)( 9,487)( 2,849) Net Cash from Operations millions 115,877 84,946 46,752 46,327 66,064 Net Cash from Investing millions( 94,342)( 49,833)( 37,601)( 58,154)( 59,611) Stock Repurchases millions -0 -0( 6,000) -0 -0 Net Cash from Financing millions( 11,812)( 15,879) 9,718 6,291( 1,104)Net Change in Cash millions 8,422 19,637 17,776( 5,900) 5,967Available durations for this statement:3 MonthsAnnual
Statistics for AMZN
Revenue
Net Income
Gross Margin %
Net Margin %
ROE %
ROA %
Loading ITables v2.3.0 from the init_notebook_mode cell...
(need help?)
Loading ITables v2.3.0 from the init_notebook_mode cell...
(need help?)
Maximum Drawdown for AMZN
AMZN
Benchmark
Loading ITables v2.3.0 from the init_notebook_mode cell...
(need help?)
GOOG
Alphabet Inc. (Services-Computer Programming, Data Processing, Etc.)
Fiscal year end : 1231 Report Date : 2024-12-31 Filing Date : 2025-02-05
Alphabet Inc.Consolidated Balance Sheets 2024 2023 2022 2021
──────────────────────────────────────────────────────────────────────────────────────────────────────────────
Cash & Equivalents millions 23,466 24,048 21,879 20,945 Accounts Receivable millions 52,340 47,964 40,258 39,304 Total Current Assets millions 163,711 171,530 164,795 188,143 Property, Plant and Equipment millions 171,036 134,345 112,668 97,599 Goodwill millions 31,885 29,198 28,960 22,956 Other Assets millions 14,874 10,051 8,707 5,361 Total Assets millions 450,256 402,392 365,264 359,268 Accounts Payable millions 7,987 7,493 5,128 6,037 Total Current Liabilities millions 89,122 81,814 69,300 64,254 Long-term Liabilities millions 4,694 4,395 2,247 2,205 Total Liabilities millions 125,172 119,013 109,120 107,633 Commitments & Contingencies Other Comprehensive Income millions( 4,800)( 4,402)( 7,603)( 1,623) Retained Earnings millions 245,084 211,247 195,563 191,484 Total Stockholders' Equity millions 325,084 283,379 256,144 251,635 Total Liabilities & Equity millions 450,256 402,392 365,264 359,268 Inventory millions 2,670 1,170
Alphabet Inc.Income Statements 2024 2023 2022 2021 2020
──────────────────────────────────────────────────────────────────────────────────────────────────────────────────────────
Revenue millions 350,018 307,394 282,836 257,637 182,527 Research & Development millions 49,326 45,427 39,500 31,562 27,573Operating Income millions 112,390 84,293 74,842 78,714 41,224Pre-tax Income millions 119,815 85,717 71,328 90,734 48,082Income Tax millions( 19,697)( 11,922)( 11,356)( 14,701)( 7,813)Net Income millions 100,118 73,795 59,972 76,033 40,269EPS Basic 8.13 5.84 4.59 5.69 2.96EPS Diluted 8.04 5.8 4.56 5.61 2.93
Alphabet Inc.Consolidated Statement of Cash Flows 2024 2023 2022 2021 2020
──────────────────────────────────────────────────────────────────────────────────────────────────────────────────────────
Stock-based Compensation millions 22,785 22,460 19,362 15,376 12,991 Net Cash from Operations millions 125,299 101,746 91,495 91,652 65,124 Capital Expenditures millions( 52,535)( 32,251)( 31,485)( 24,640)( 22,281) Net Cash from Investing millions( 45,536)( 27,063)( 20,298)( 35,523)( 32,773) Stock Repurchases millions( 62,222)( 61,504)( 59,296)( 50,274)( 31,149) Net Cash from Financing millions( 79,733)( 72,093)( 69,757)( 61,362)( 24,408)Net Change in Cash millions( 582) 2,169 934( 5,520) 7,967Total Cash and Equivalents millions 23,466 24,048 21,879 20,945 26,465
Statistics for GOOG
Revenue
Net Income
Gross Margin %
Net Margin %
ROE %
ROA %
Loading ITables v2.3.0 from the init_notebook_mode cell...
(need help?)
Performance Details for GOOG
7
Loading ITables v2.3.0 from the init_notebook_mode cell...
(need help?)
Maximum Drawdown for GOOG
GOOG
Benchmark
Loading ITables v2.3.0 from the init_notebook_mode cell...
(need help?)
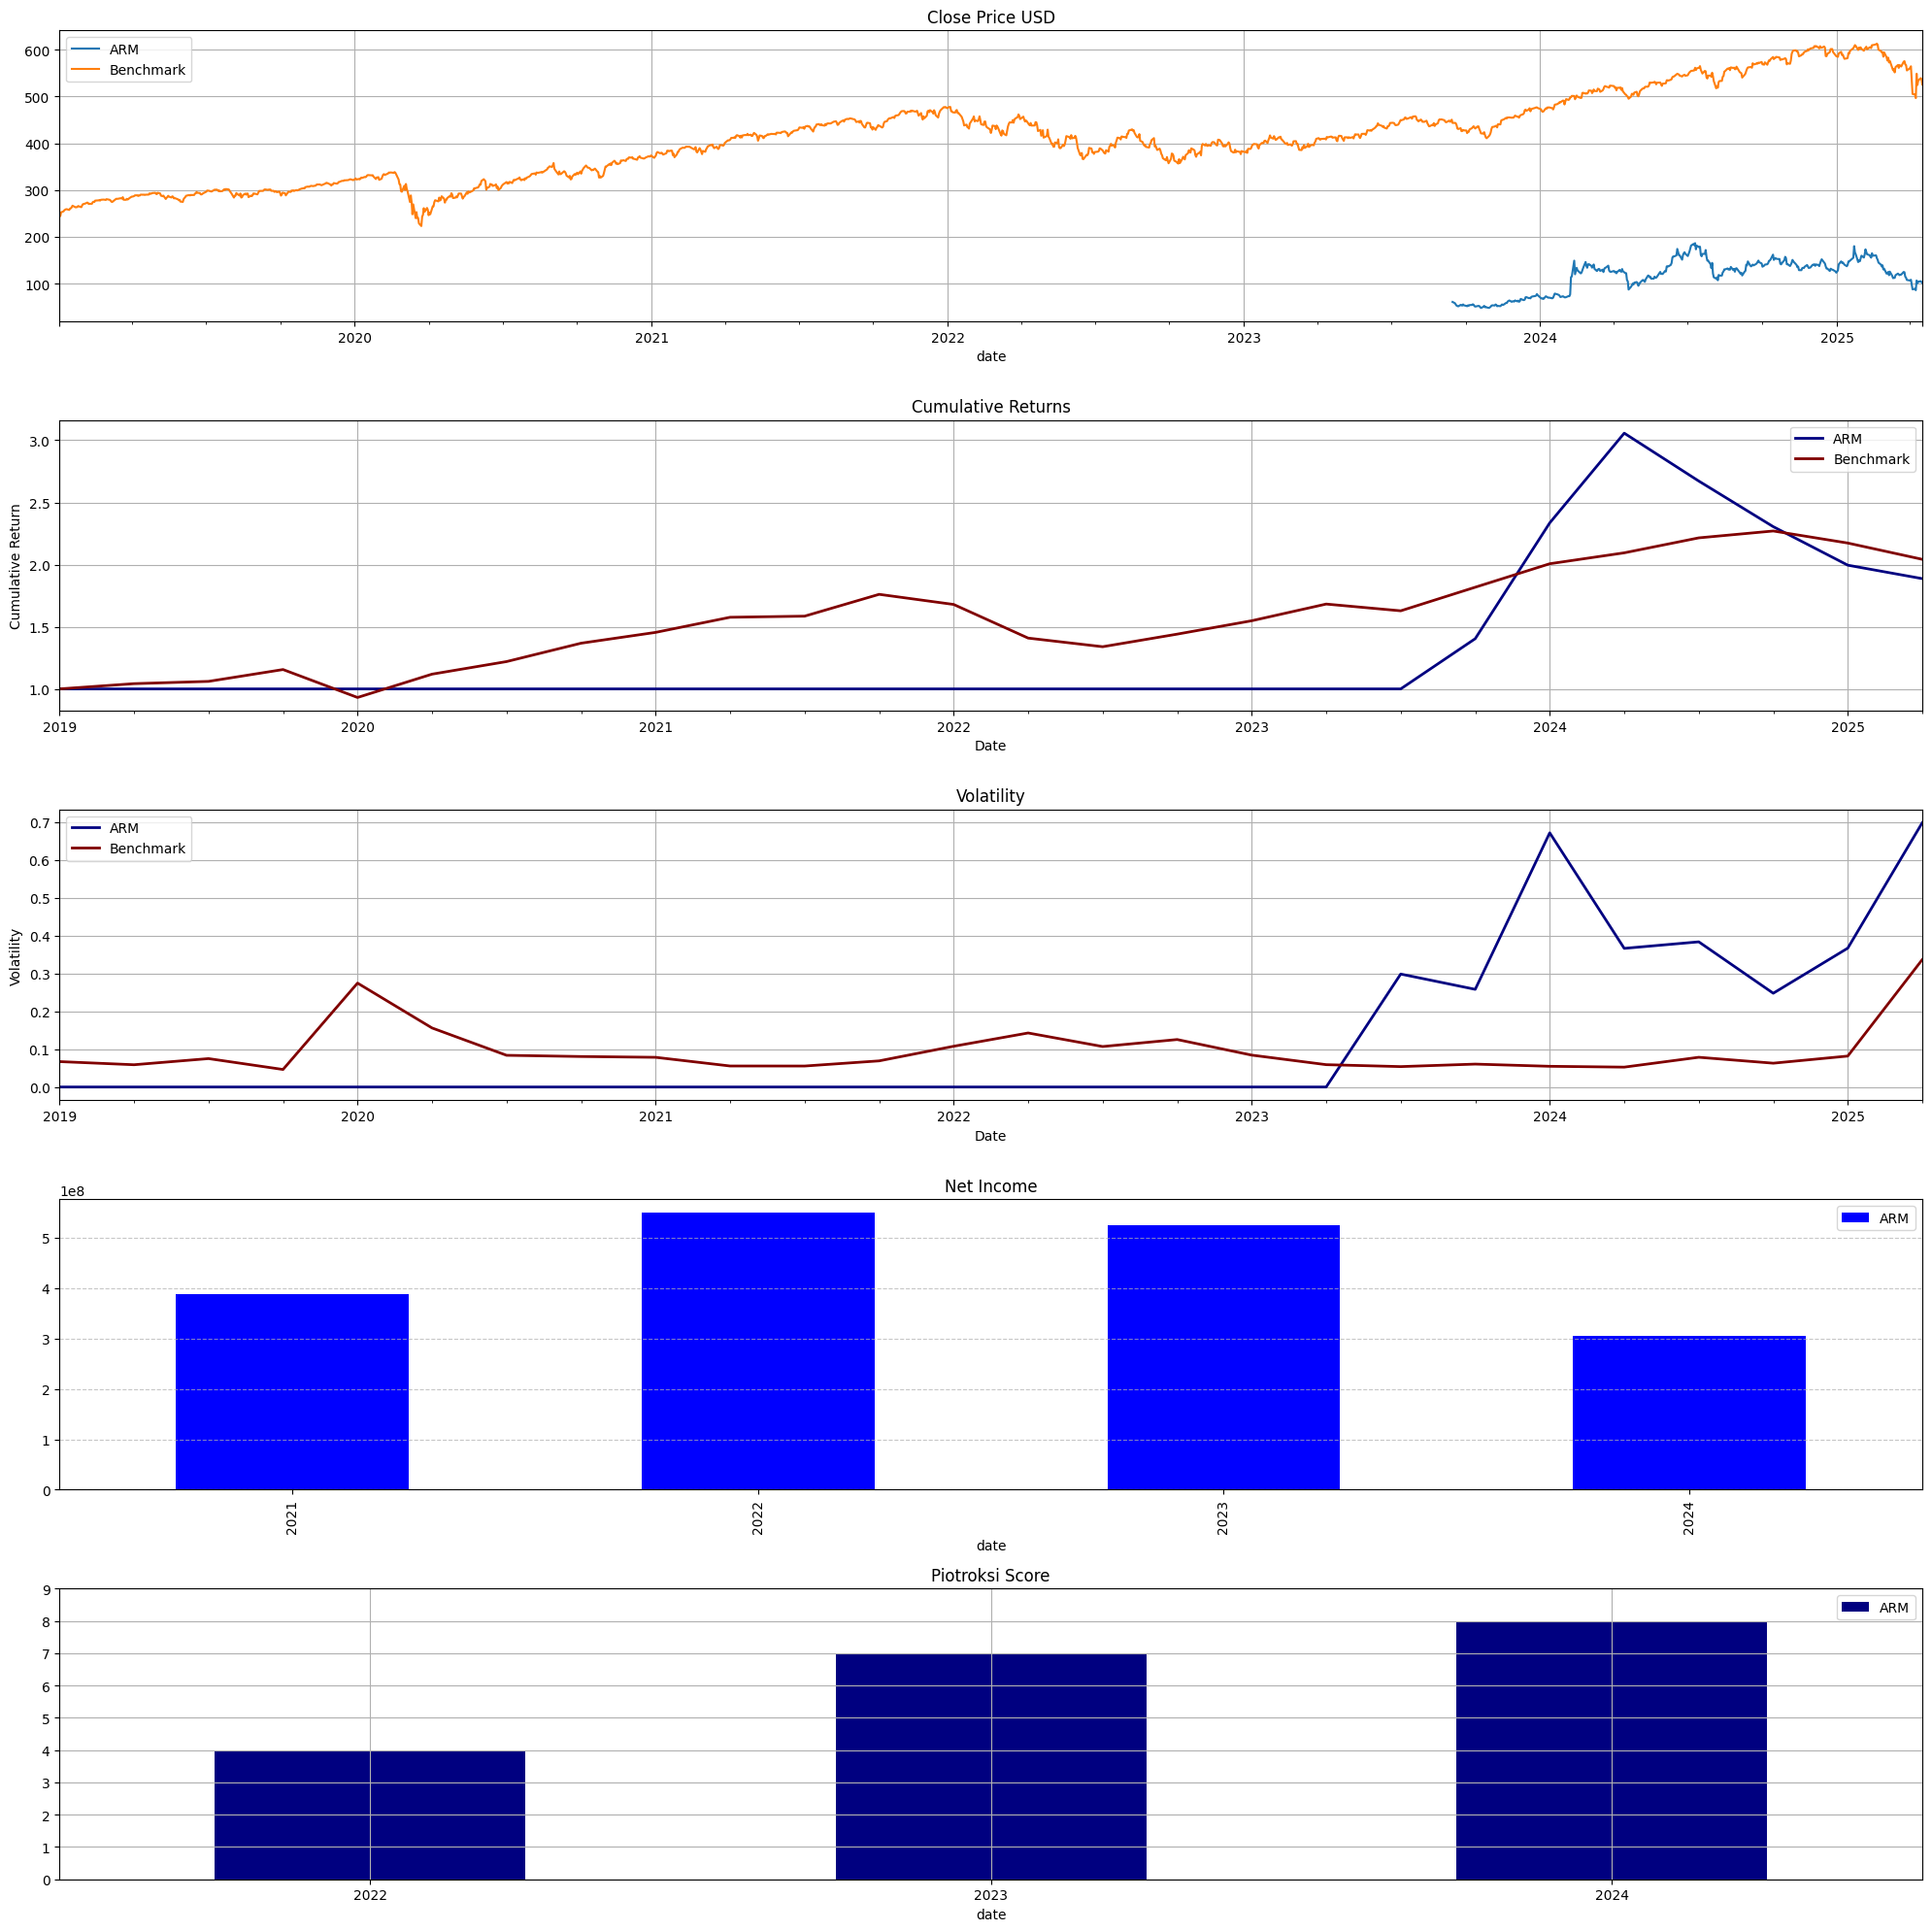
ARM
Performance Details for ARM
8
Loading ITables v2.3.0 from the init_notebook_mode cell...
(need help?)
Maximum Drawdown for ARM
ARM
Benchmark
Loading ITables v2.3.0 from the init_notebook_mode cell...
(need help?)
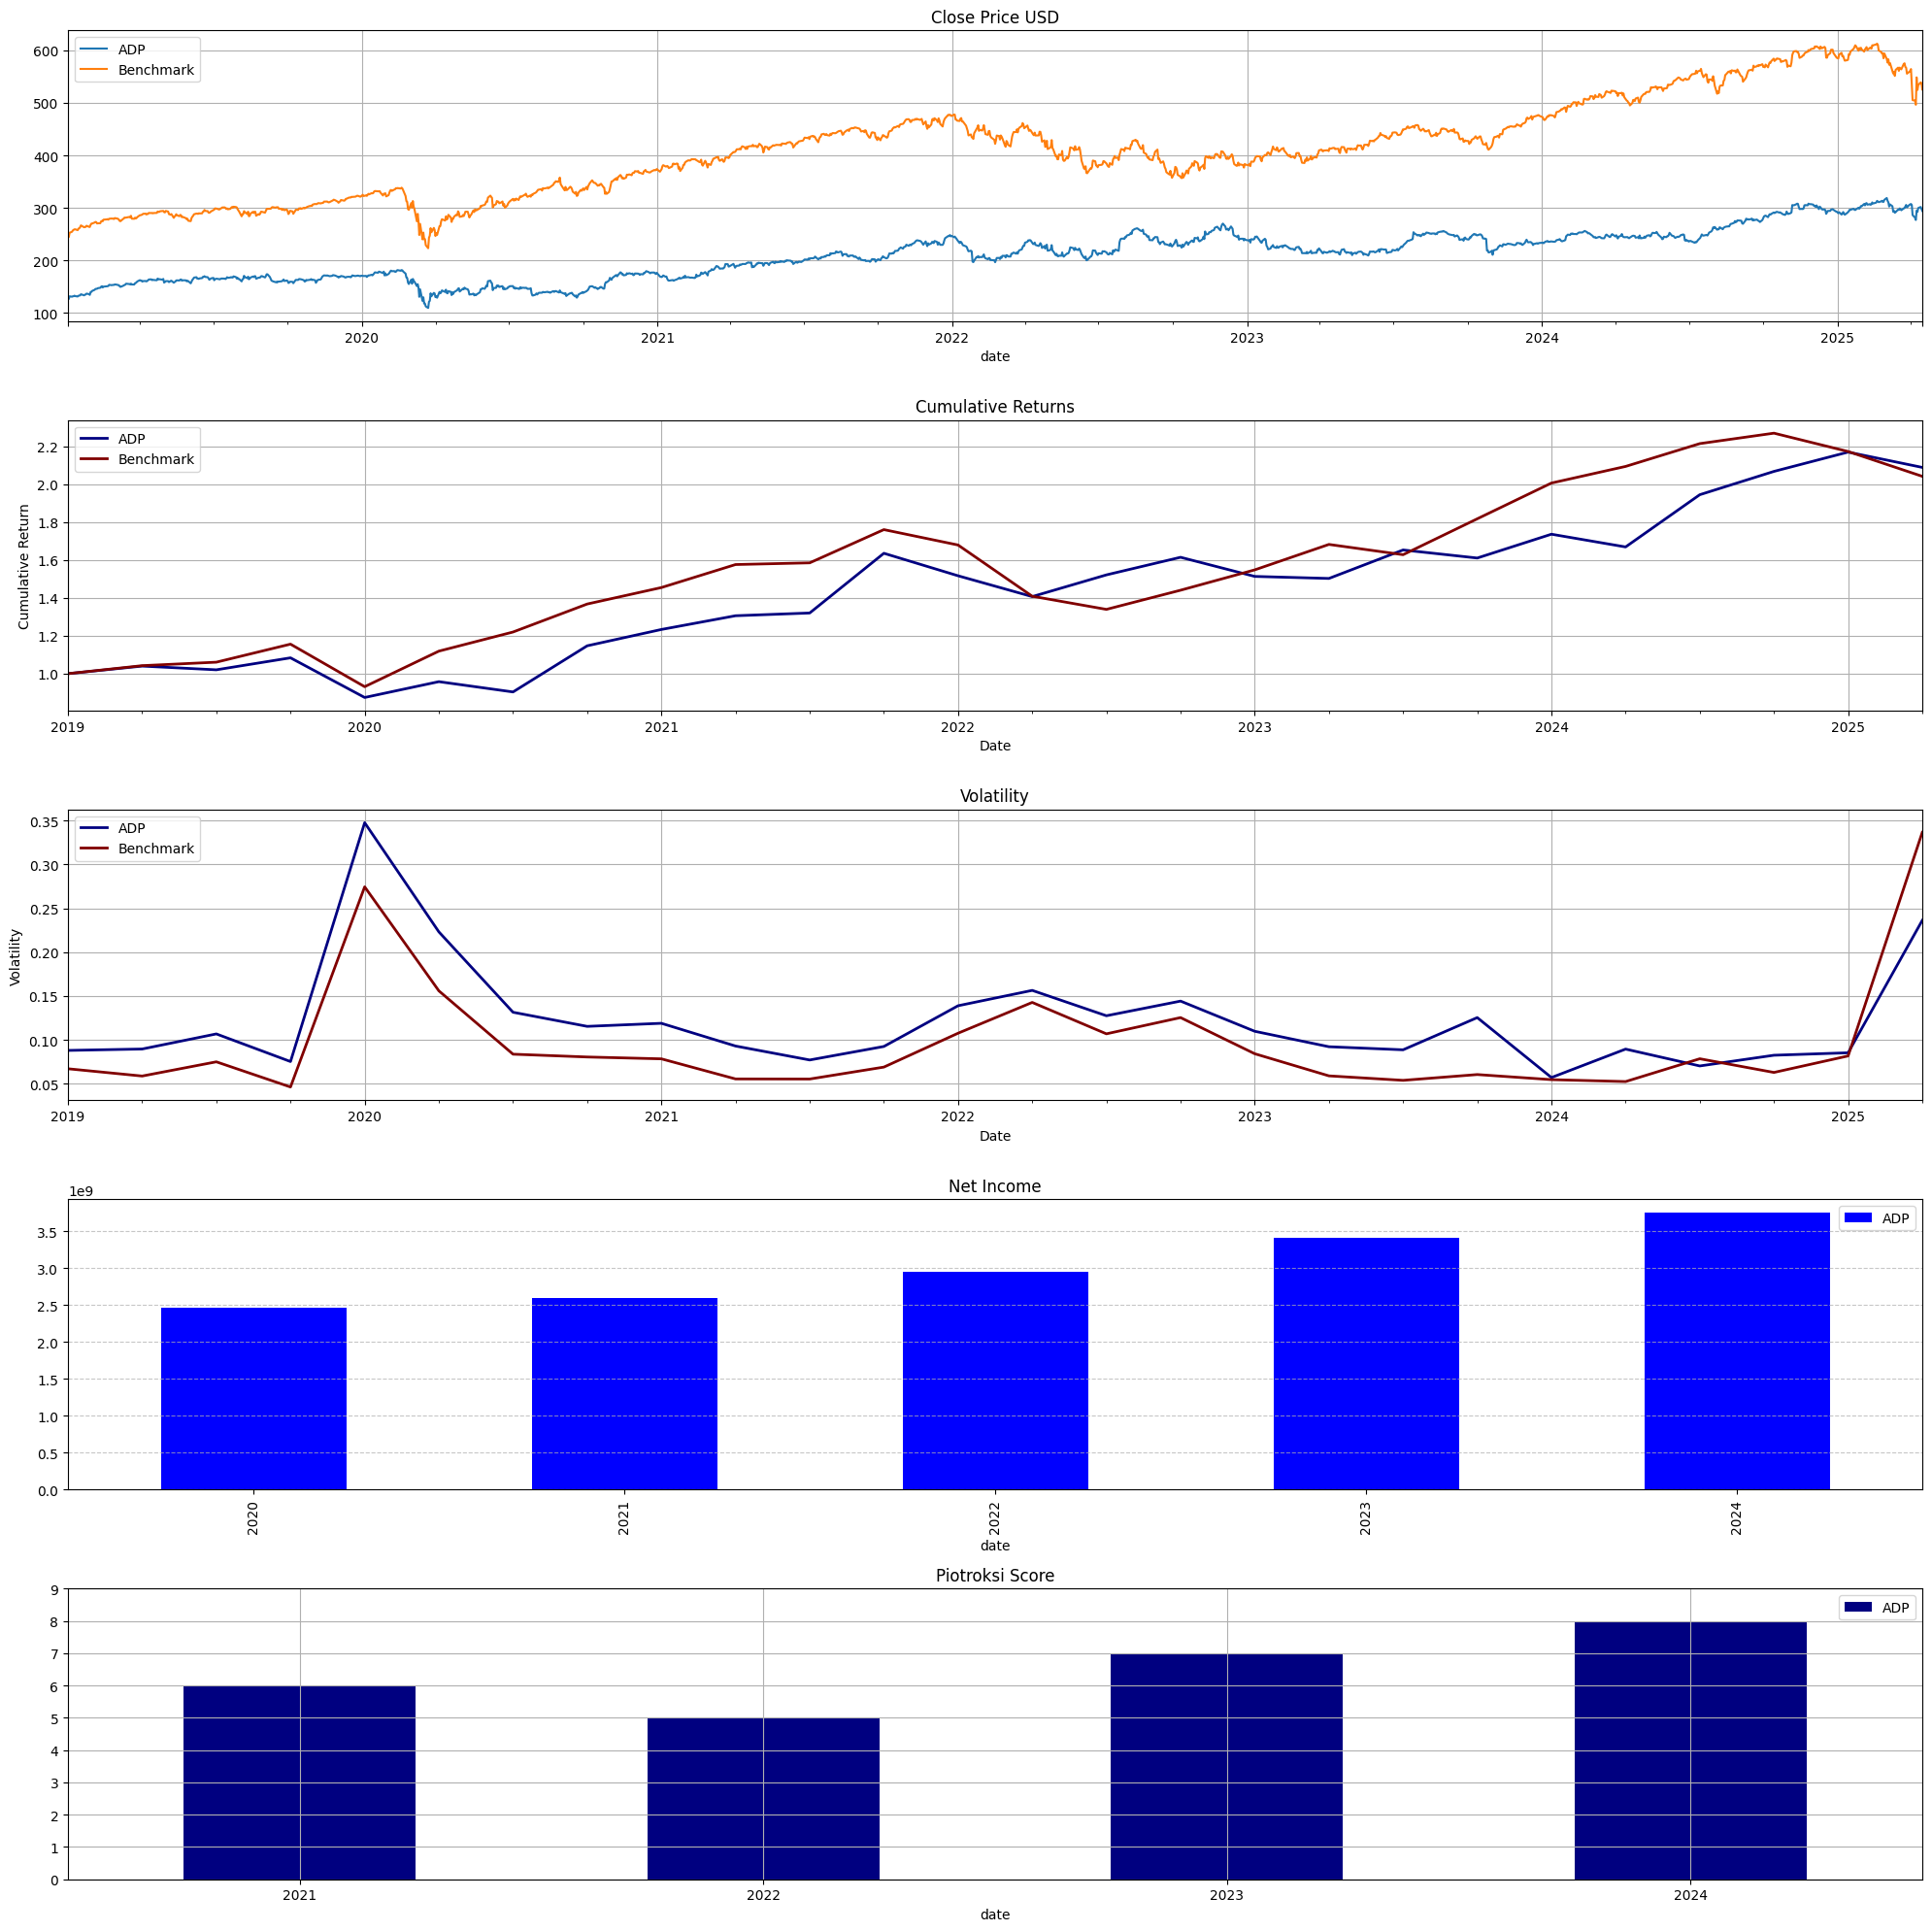
ADP
AUTOMATIC DATA PROCESSING INC (Services-Computer Processing & Data Preparation)
Fiscal year end : 0630 Report Date : 2024-06-30 Filing Date : 2024-08-07
AUTOMATIC DATA PROCESSING, INC.Consolidated Balance Sheets 2024 2023 2022 2021
────────────────────────────────────────────────────────────────────────────────────────────────────
Cash & Equivalents 29,134 20,835 14,363 25,752 Accounts Receivable 34,282 30,096 31,706 27,274 Total Current Assets 455,425 421,706 548,049 407,418 Property, Plant and Equipment 6,856 6,814 6,526 6,845 Other Assets 11,021 12,554 9,374 8,258 Goodwill 23,536 23,394 23,005 23,384 Total Assets 543,627 509,710 630,682 487,725 Accounts Payable 1,006 968 1,102 1,411 Total Current Liabilities 450,800 427,676 551,587 380,948 Long-term Liabilities 9,908 9,337 9,242 8,341 Total Liabilities 498,151 474,619 598,429 431,024 Commitments & Contingencies Common Stock 639 639 639 639 Retained Earnings 236,222 221,180 206,963 194,511 Other Comprehensive Income ( 18,083)( 23,058)( 19,937) 106 Total Stockholders' Equity 45,476 35,091 32,253 56,701 Total Liabilities & Equity 543,627 509,710 630,682 487,725
Loading ITables v2.3.0 from the init_notebook_mode cell...
(need help?)
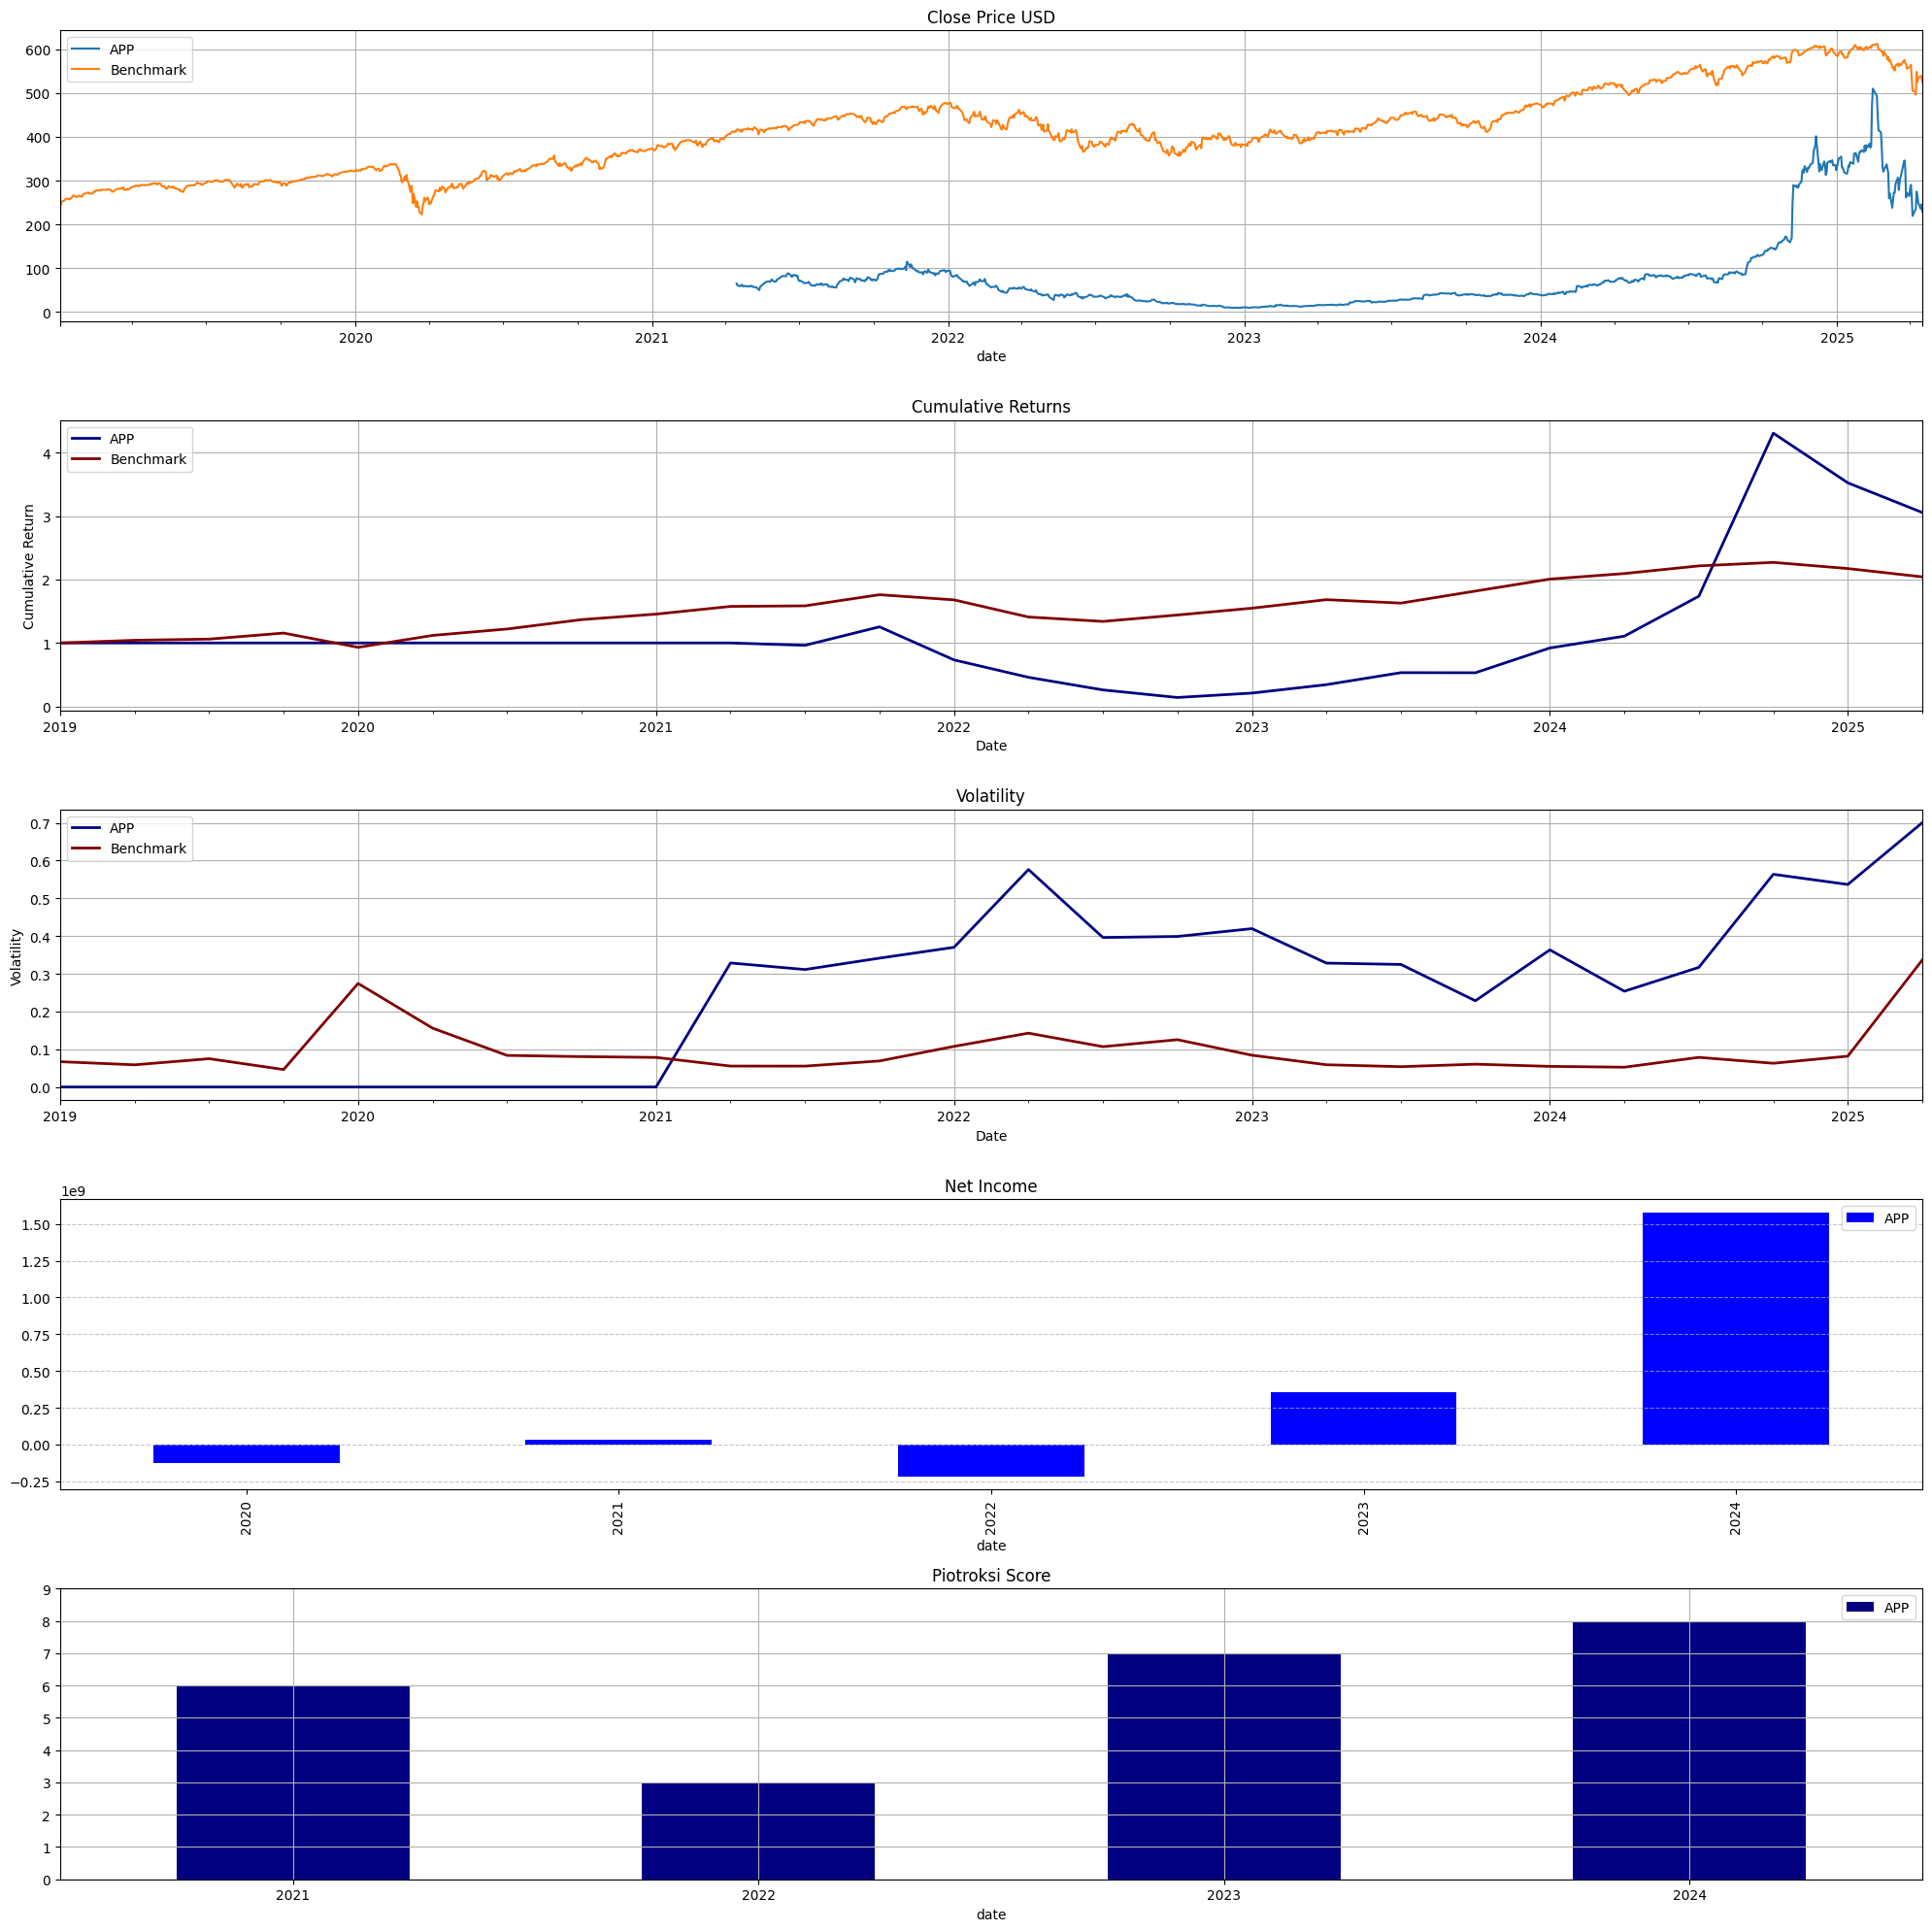
Maximum Drawdown for APP
APP
Benchmark
Loading ITables v2.3.0 from the init_notebook_mode cell...
(need help?)
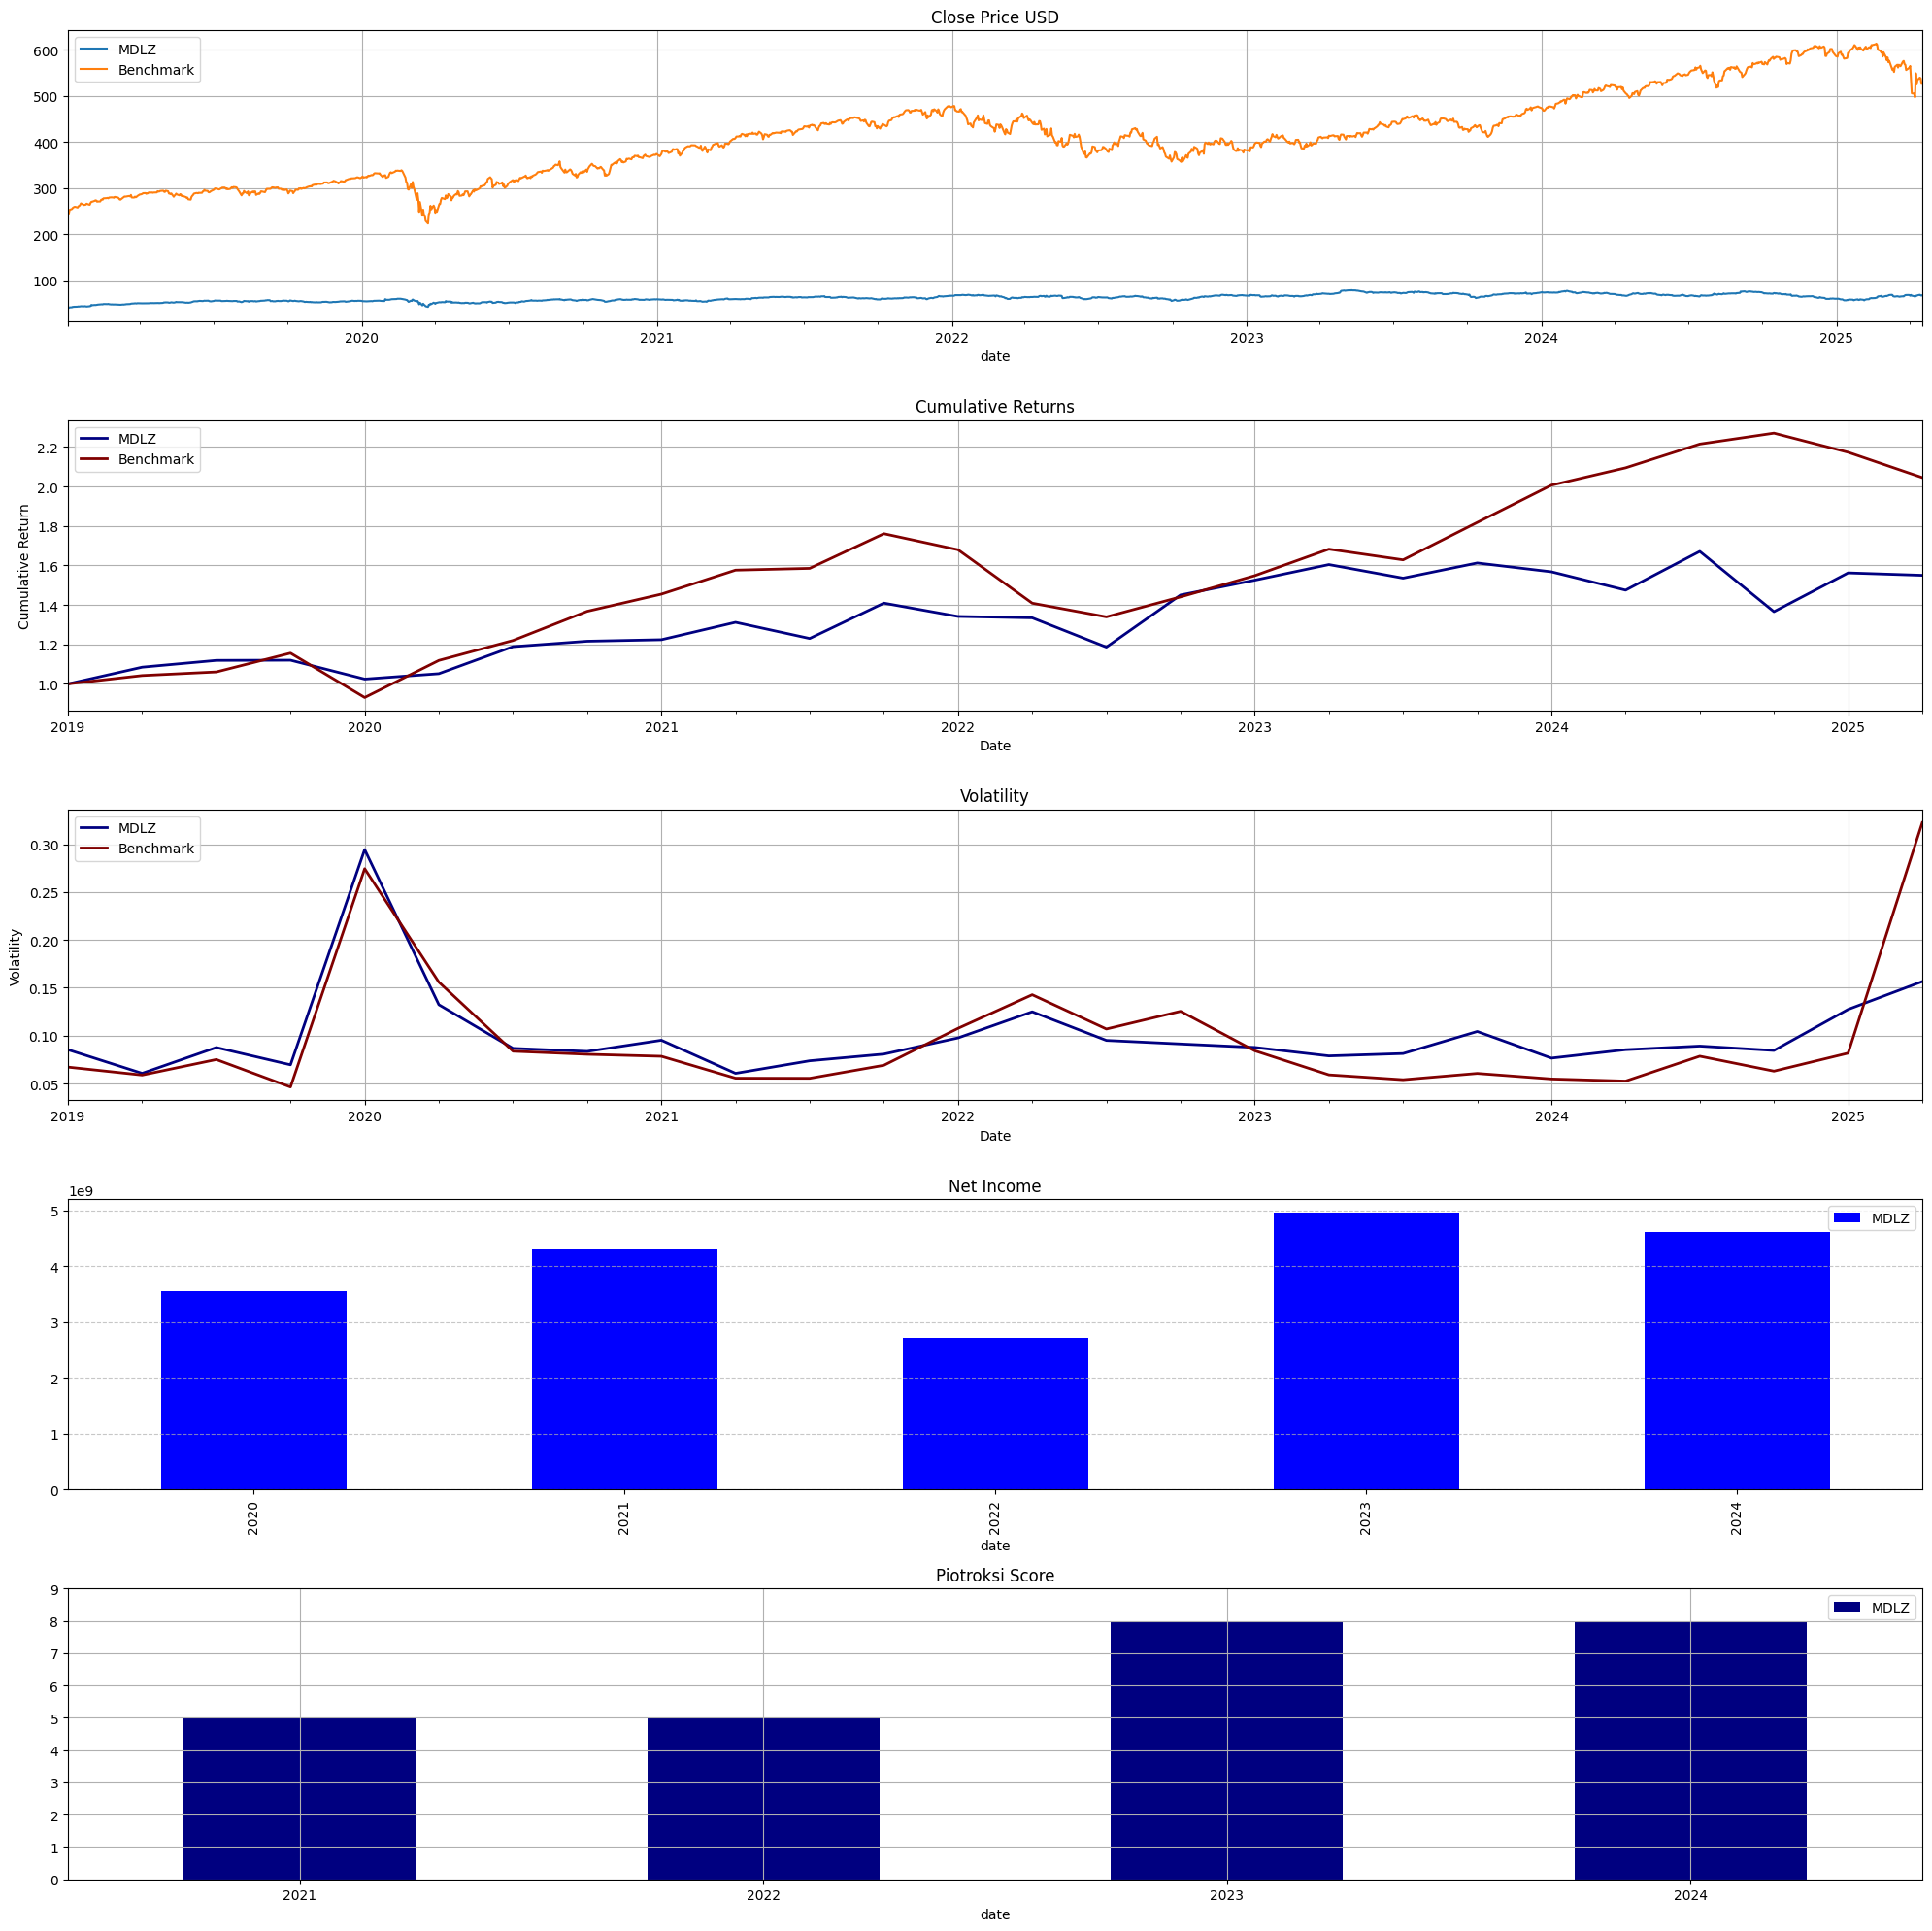
MDLZ
Mondelez International, Inc. (Food and Kindred Products)
Fiscal year end : 1231 Report Date : 2024-12-31 Filing Date : 2025-02-05
Mondelēz International, Inc.Consolidated Balance Sheets 2024 2023 2022 2021
──────────────────────────────────────────────────────────────────────────────────────────────────────────────
Accounts Receivable millions 3,874 3,634 3,088 2,337 Inventory millions 3,827 3,615 3,381 2,708 Total Current Assets millions 13,242 11,703 10,091 10,342 Goodwill millions 23,017 23,896 23,450 21,978 Other Assets millions 1,187 886 1,862 371 Total Assets millions 68,497 71,391 71,161 67,092 Accounts Payable millions 9,433 8,321 7,562 6,730 Total Current Liabilities millions 19,549 19,013 16,731 14,008 Long-term Liabilities millions 1,789 2,735 2,688 2,326 Total Liabilities millions 41,539 43,025 44,241 38,769Commitments & Contingencies Common Stock millions 0 0 0 0 Retained Earnings millions 36,476 34,236 31,481 30,806 Other Comprehensive Income millions( 12,471)( 10,946)( 10,947)( 10,624) Total Stockholders' Equity millions 26,932 28,332 26,883 28,269Total Liabilities & Equity millions 68,497 71,391 71,161 67,092
Mondelēz International, Inc.Consolidated Statement of Cash Flows 2024 2023 2022 2021 2020
──────────────────────────────────────────────────────────────────────────────────────────────────────────────────────────
Stock-based Compensation millions 147 146 120 121 126 Inventories millions( 458)( 193)( 635)( 170)( 24) Net Cash from Operations millions 4,910 4,714 3,908 4,141 3,964 Capital Expenditures ( 14)( 11)( 9)( 10)( 9) Net Cash from Investing millions 526 2,812( 4,888)( 26) 500 Stock Repurchases millions( 2,334)( 1,547)( 2,017)( 2,110)( 1,390) Net Cash from Financing millions( 5,780)( 7,558)( 456)( 4,069)( 2,215) Net Change in Cash millions( 484)( 64)( 1,605)( 97) 2,322 Total Cash and Equivalents millions 1,400 1,884 1,948 3,553 3,650Available durations for this statement:1 MonthAnnual
Statistics for MDLZ
Revenue
Net Income
Gross Margin %
Net Margin %
ROE %
ROA %
Loading ITables v2.3.0 from the init_notebook_mode cell...
(need help?)
Insights for MDLZ
ROE < 5.0%
Performance Details for MDLZ
12
Loading ITables v2.3.0 from the init_notebook_mode cell...
(need help?)
Maximum Drawdown for MDLZ
MDLZ
Benchmark
Loading ITables v2.3.0 from the init_notebook_mode cell...
(need help?)
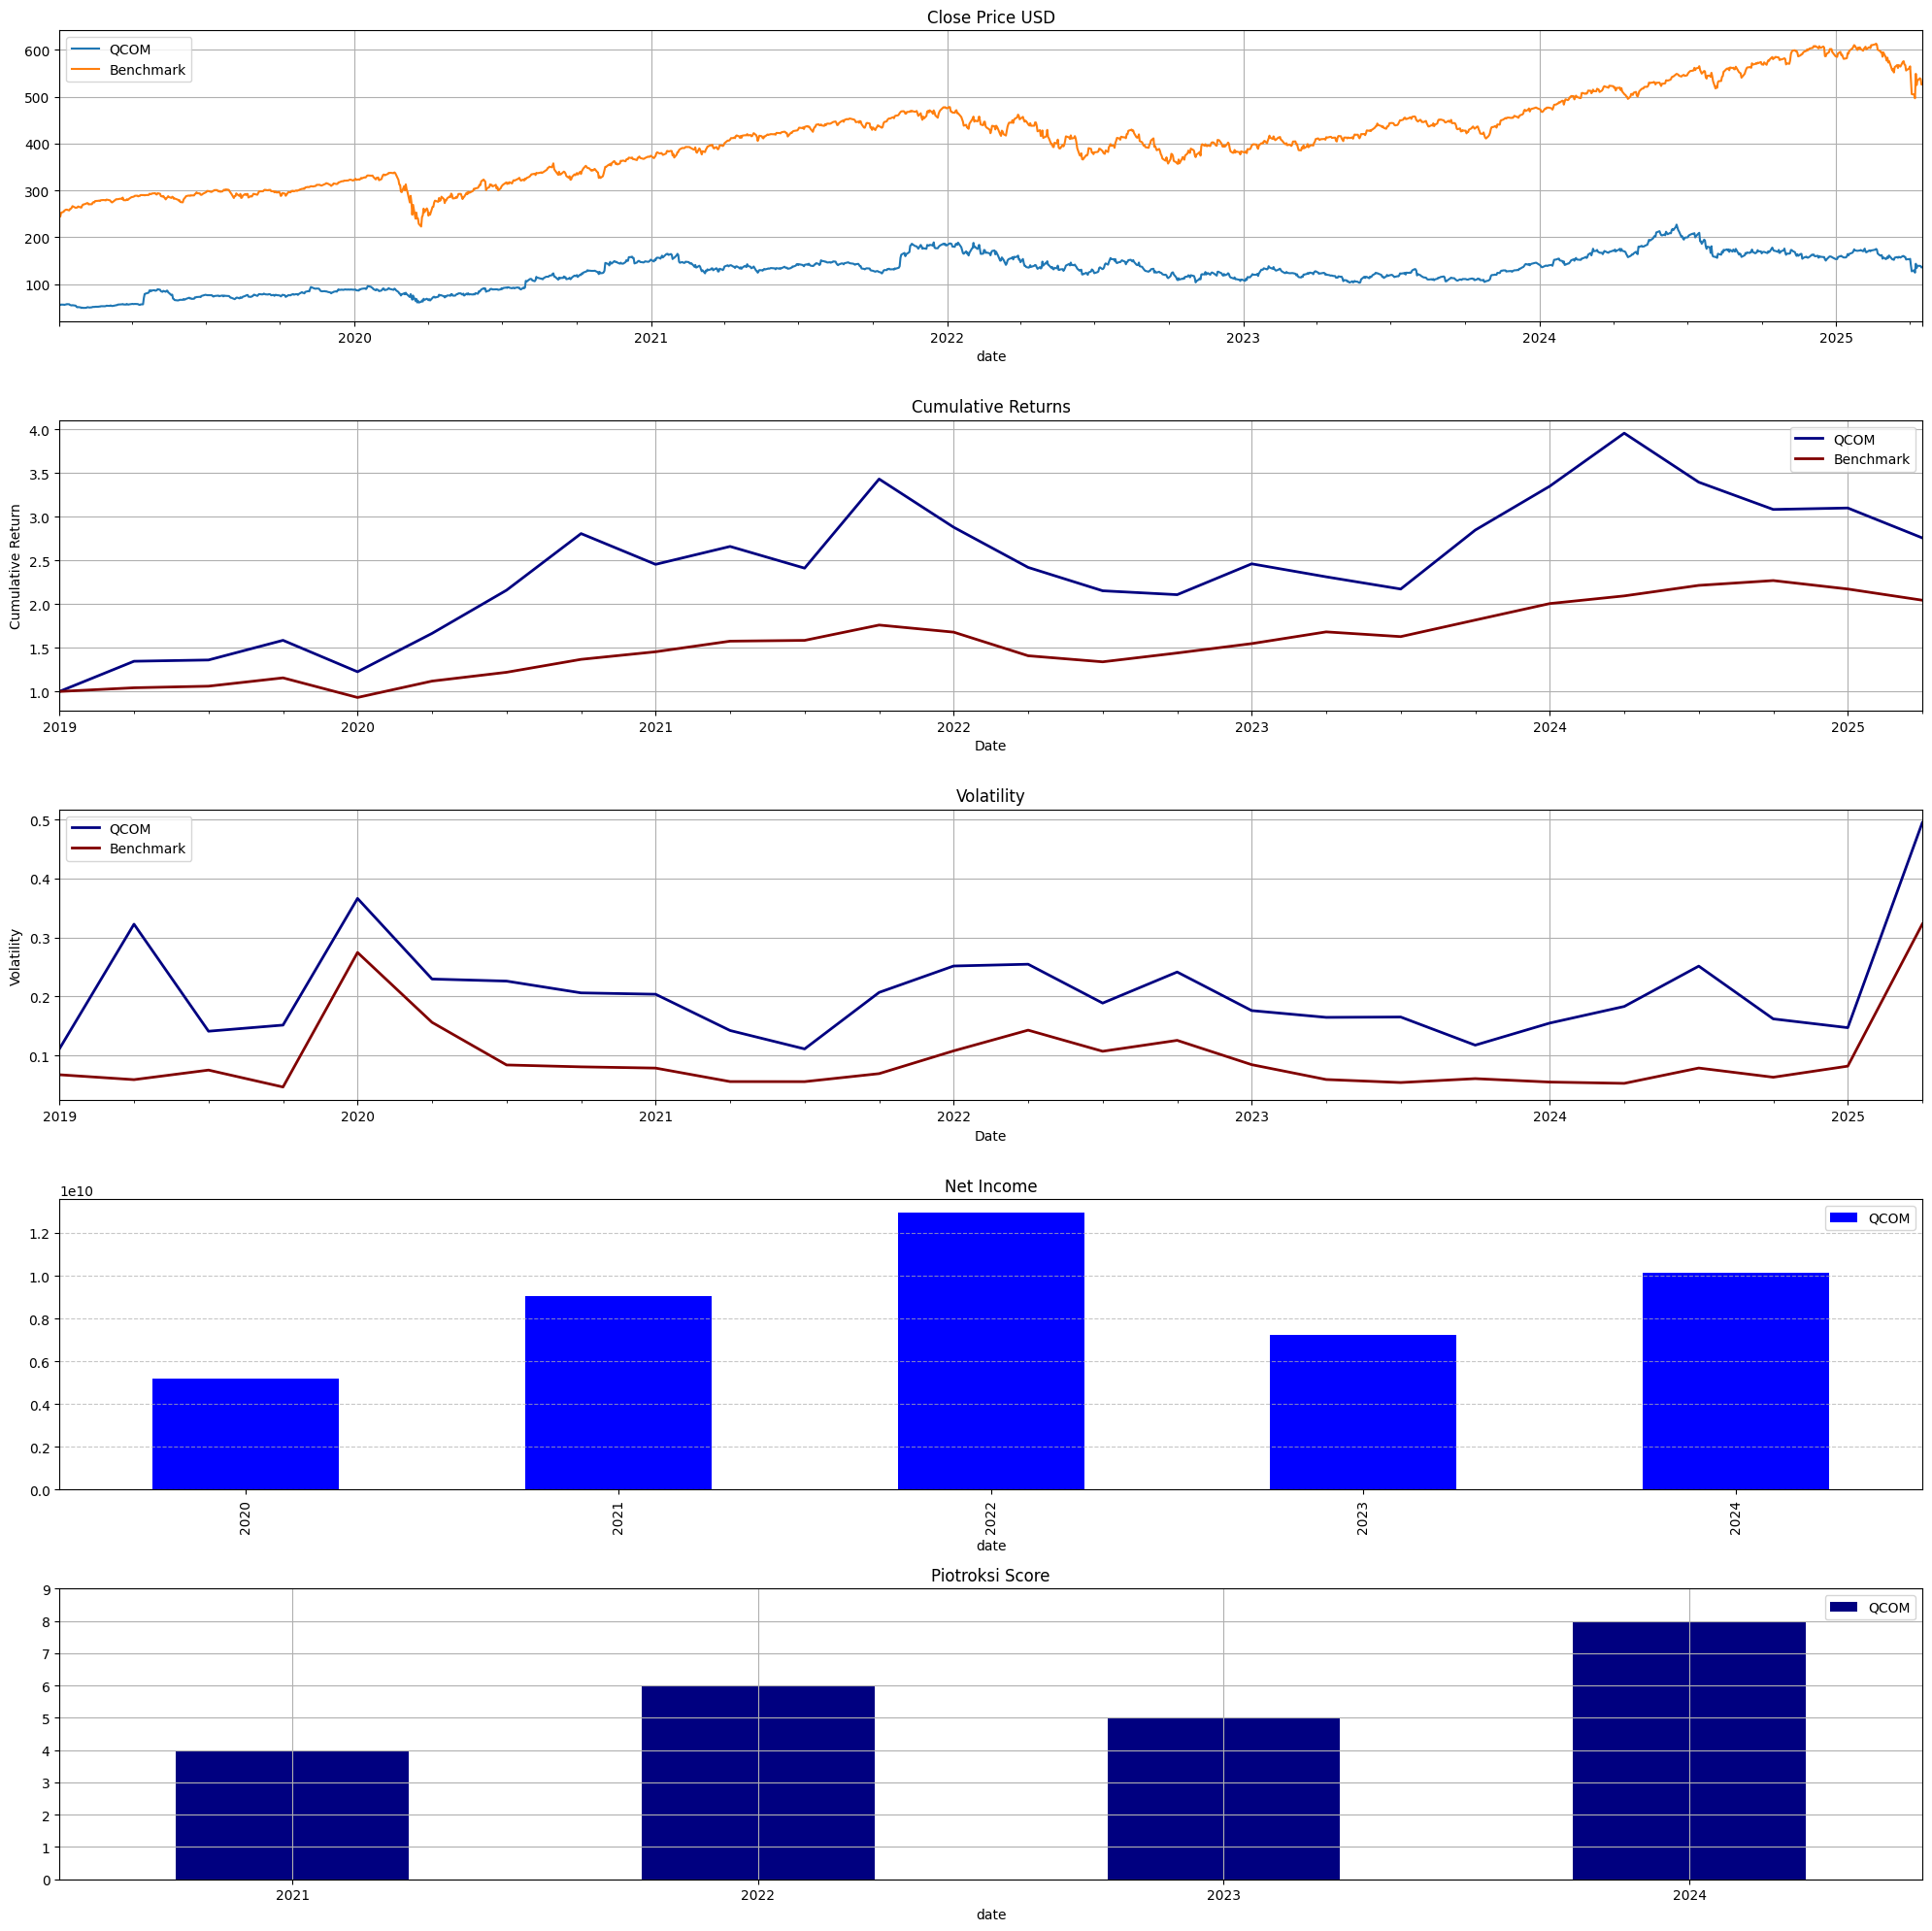
QCOM
QUALCOMM INC/DE (Radio & Tv Broadcasting & Communications Equipment)
Fiscal year end : 0928 Report Date : 2024-09-29 Filing Date : 2024-11-06
QUALCOMM INC/DEConsolidated Balance Sheets 2024 2023 2022 2021
────────────────────────────────────────────────────────────────────────────────────────────────────────
Cash & Equivalents millions 7,849 8,450 2,773 7,116 Inventory millions 6,423 6,422 6,341 3,228 Total Current Assets millions 25,231 22,464 20,724 20,075 Property, Plant and Equipment millions 4,665 5,042 5,168 4,559 Goodwill millions 10,799 10,642 10,508 7,246 Other Assets millions 8,053 8,086 7,729 6,311 Total Assets millions 55,154 51,040 49,014 41,240 Accounts Payable millions 2,584 1,912 3,796 2,750 Total Current Liabilities millions 10,504 9,628 11,866 11,951 Total Liabilities millions 28,880 29,459 31,001 31,290 Commitments & Contingencies Retained Earnings millions 25,687 20,733 17,840 9,822 Other Comprehensive Income millions 587 358( 22) 128 Total Liabilities & Equity millions 55,154 51,040 49,014 41,240
QUALCOMM INC/DEIncome Statements 2024 2023 2022 2021 2020
──────────────────────────────────────────────────────────────────────────────────────────────────────────────────────────
Research & Development millions 8,893 8,818 8,194 7,176 5,975Selling, General & Admin millions 2,759 2,483 2,570 2,339 2,074Operating Income millions 10,071 7,788 15,860 9,789 6,255Pre-tax Income millions 10,336 7,443 14,998 10,274 5,719Income Tax millions( 226)( 104)( 2,012)( 1,231)( 521)Net Income millions 10,142 7,232 12,936 9,043 5,198EPS Basic 9.09 6.47 11.52 7.99 4.58EPS Diluted 8.97 6.42 11.37 7.87 4.52 Shares Basic millions 1,116 1,117 1,123 1,131 1,135 Shares Diluted millions 1,130 1,126 1,137 1,149 1,149Available durations for this statement:9 MonthsAnnual
QUALCOMM INC/DEConsolidated Statement of Cash Flows 2024 2023 2022 2021 2020
──────────────────────────────────────────────────────────────────────────────────────────────────────────────────────────
Stock-based Compensation millions 2,648 2,484 2,031 1,663 1,212 Inventories millions( 13)( 8)( 3,137)( 622)( 1,157) Net Cash from Operations millions 12,202 11,299 9,096 10,536 5,814 Net Cash from Investing millions( 3,623) 762( 5,804)( 3,356)( 5,263) Stock Repurchases millions( 4,121)( 2,973)( 3,129)( 3,366)( 2,450) Net Cash from Financing millions( 9,269)( 6,663)( 7,196)( 6,798)( 5,707)Net Change in Cash millions( 678) 5,428( 4,017) 409( 5,132)Total Cash and Equivalents millions 7,849 8,527 3,099 7,116 6,707Available durations for this statement:9 MonthsAnnual
Statistics for QCOM
Revenue
Net Income
Gross Margin %
Net Margin %
ROE %
ROA %
Loading ITables v2.3.0 from the init_notebook_mode cell...
(need help?)
Performance Details for QCOM
13
Loading ITables v2.3.0 from the init_notebook_mode cell...
(need help?)
Maximum Drawdown for QCOM
QCOM
Benchmark
Loading ITables v2.3.0 from the init_notebook_mode cell...
(need help?)
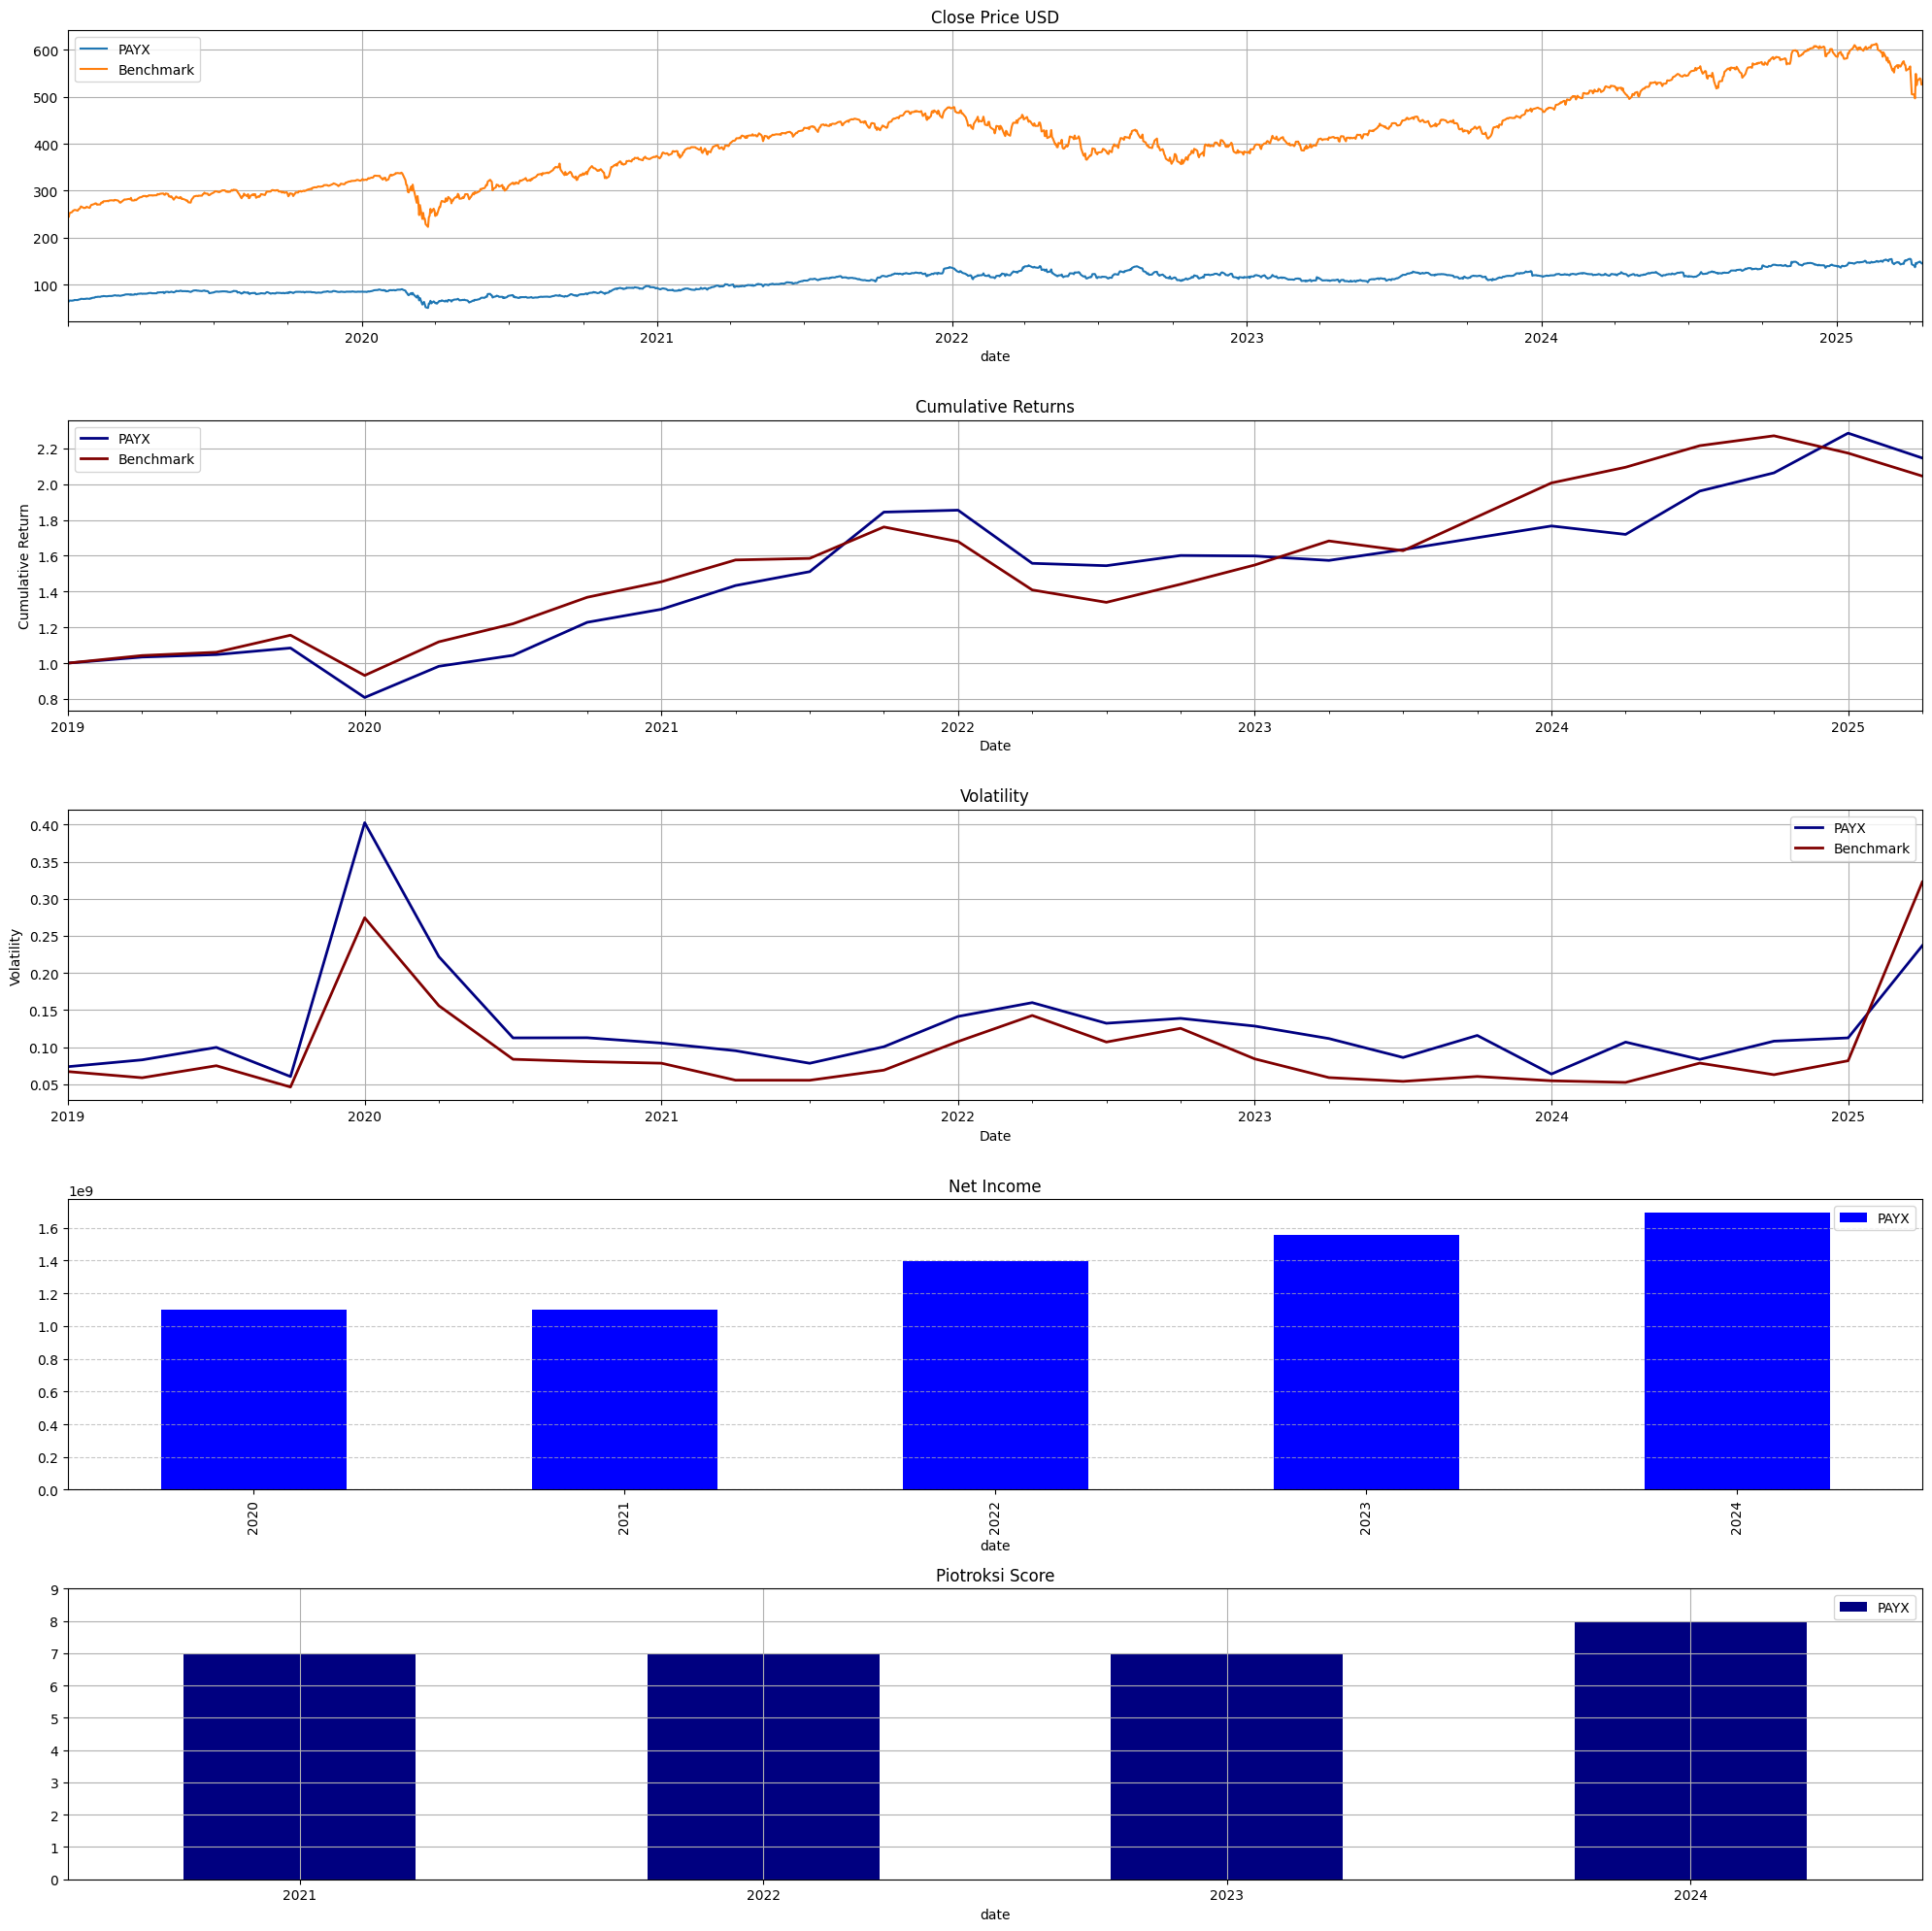
PAYX
PAYCHEX INC (Services-Engineering, Accounting, Research, Management)
Fiscal year end : 0531 Report Date : 2024-05-31 Filing Date : 2024-07-11
Paychex, Inc.Consolidated Balance Sheets 2024 2023 2022 2021
────────────────────────────────────────────────────────────────────────────────────────────────────
Cash & Equivalents 14,689 12,220 3,700 9,952 Total Current Assets 72,515 75,281 65,816 61,695 Property, Plant and Equipment 4,117 3,963 4,013 3,958 Goodwill 18,827 18,340 18,315 18,207 Other Assets 1,150 652 537 342 Total Assets 103,831 105,464 96,352 92,272 Accounts Payable 1,043 847 1,057 890 Total Current Liabilities 53,091 58,054 52,692 49,382 Long-term Liabilities 2,368 1,972 1,847 2,075 Total Liabilities 65,821 70,532 65,500 62,792Commitments & Contingencies Common Stock 36 36 36 36 Retained Earnings 22,130 20,231 16,696 14,459 Other Comprehensive Income ( 1,451)( 1,599)( 1,339) 518 Total Stockholders' Equity 38,010 34,932 30,852 29,480Total Liabilities & Equity 103,831 105,464 96,352 92,272
Palo Alto Networks, IncConsolidated Statement of Cash Flows 2024 2023 2022 2021 2020
──────────────────────────────────────────────────────────────────────────────────────────────────────────────────
Stock-based Compensation 10,754 10,745 10,111 8,945 6,584 Net Cash from Operations 32,576 27,775 19,847 15,030 10,357 Net Cash from Investing ( 15,099)( 20,338)( 9,334)( 14,806) 2,880 Stock Repurchases ( 5,667)( 2,727)( 8,923)( 11,781)( 11,981) Net Cash from Financing ( 13,431)( 17,263)( 8,066)( 11,040) 6,730Net Change in Cash 4,046( 9,826) 2,447( 10,816) 19,967Total Cash and Equivalents 15,468 11,422 21,248 18,801 29,617Available durations for this statement:1 MonthAnnual
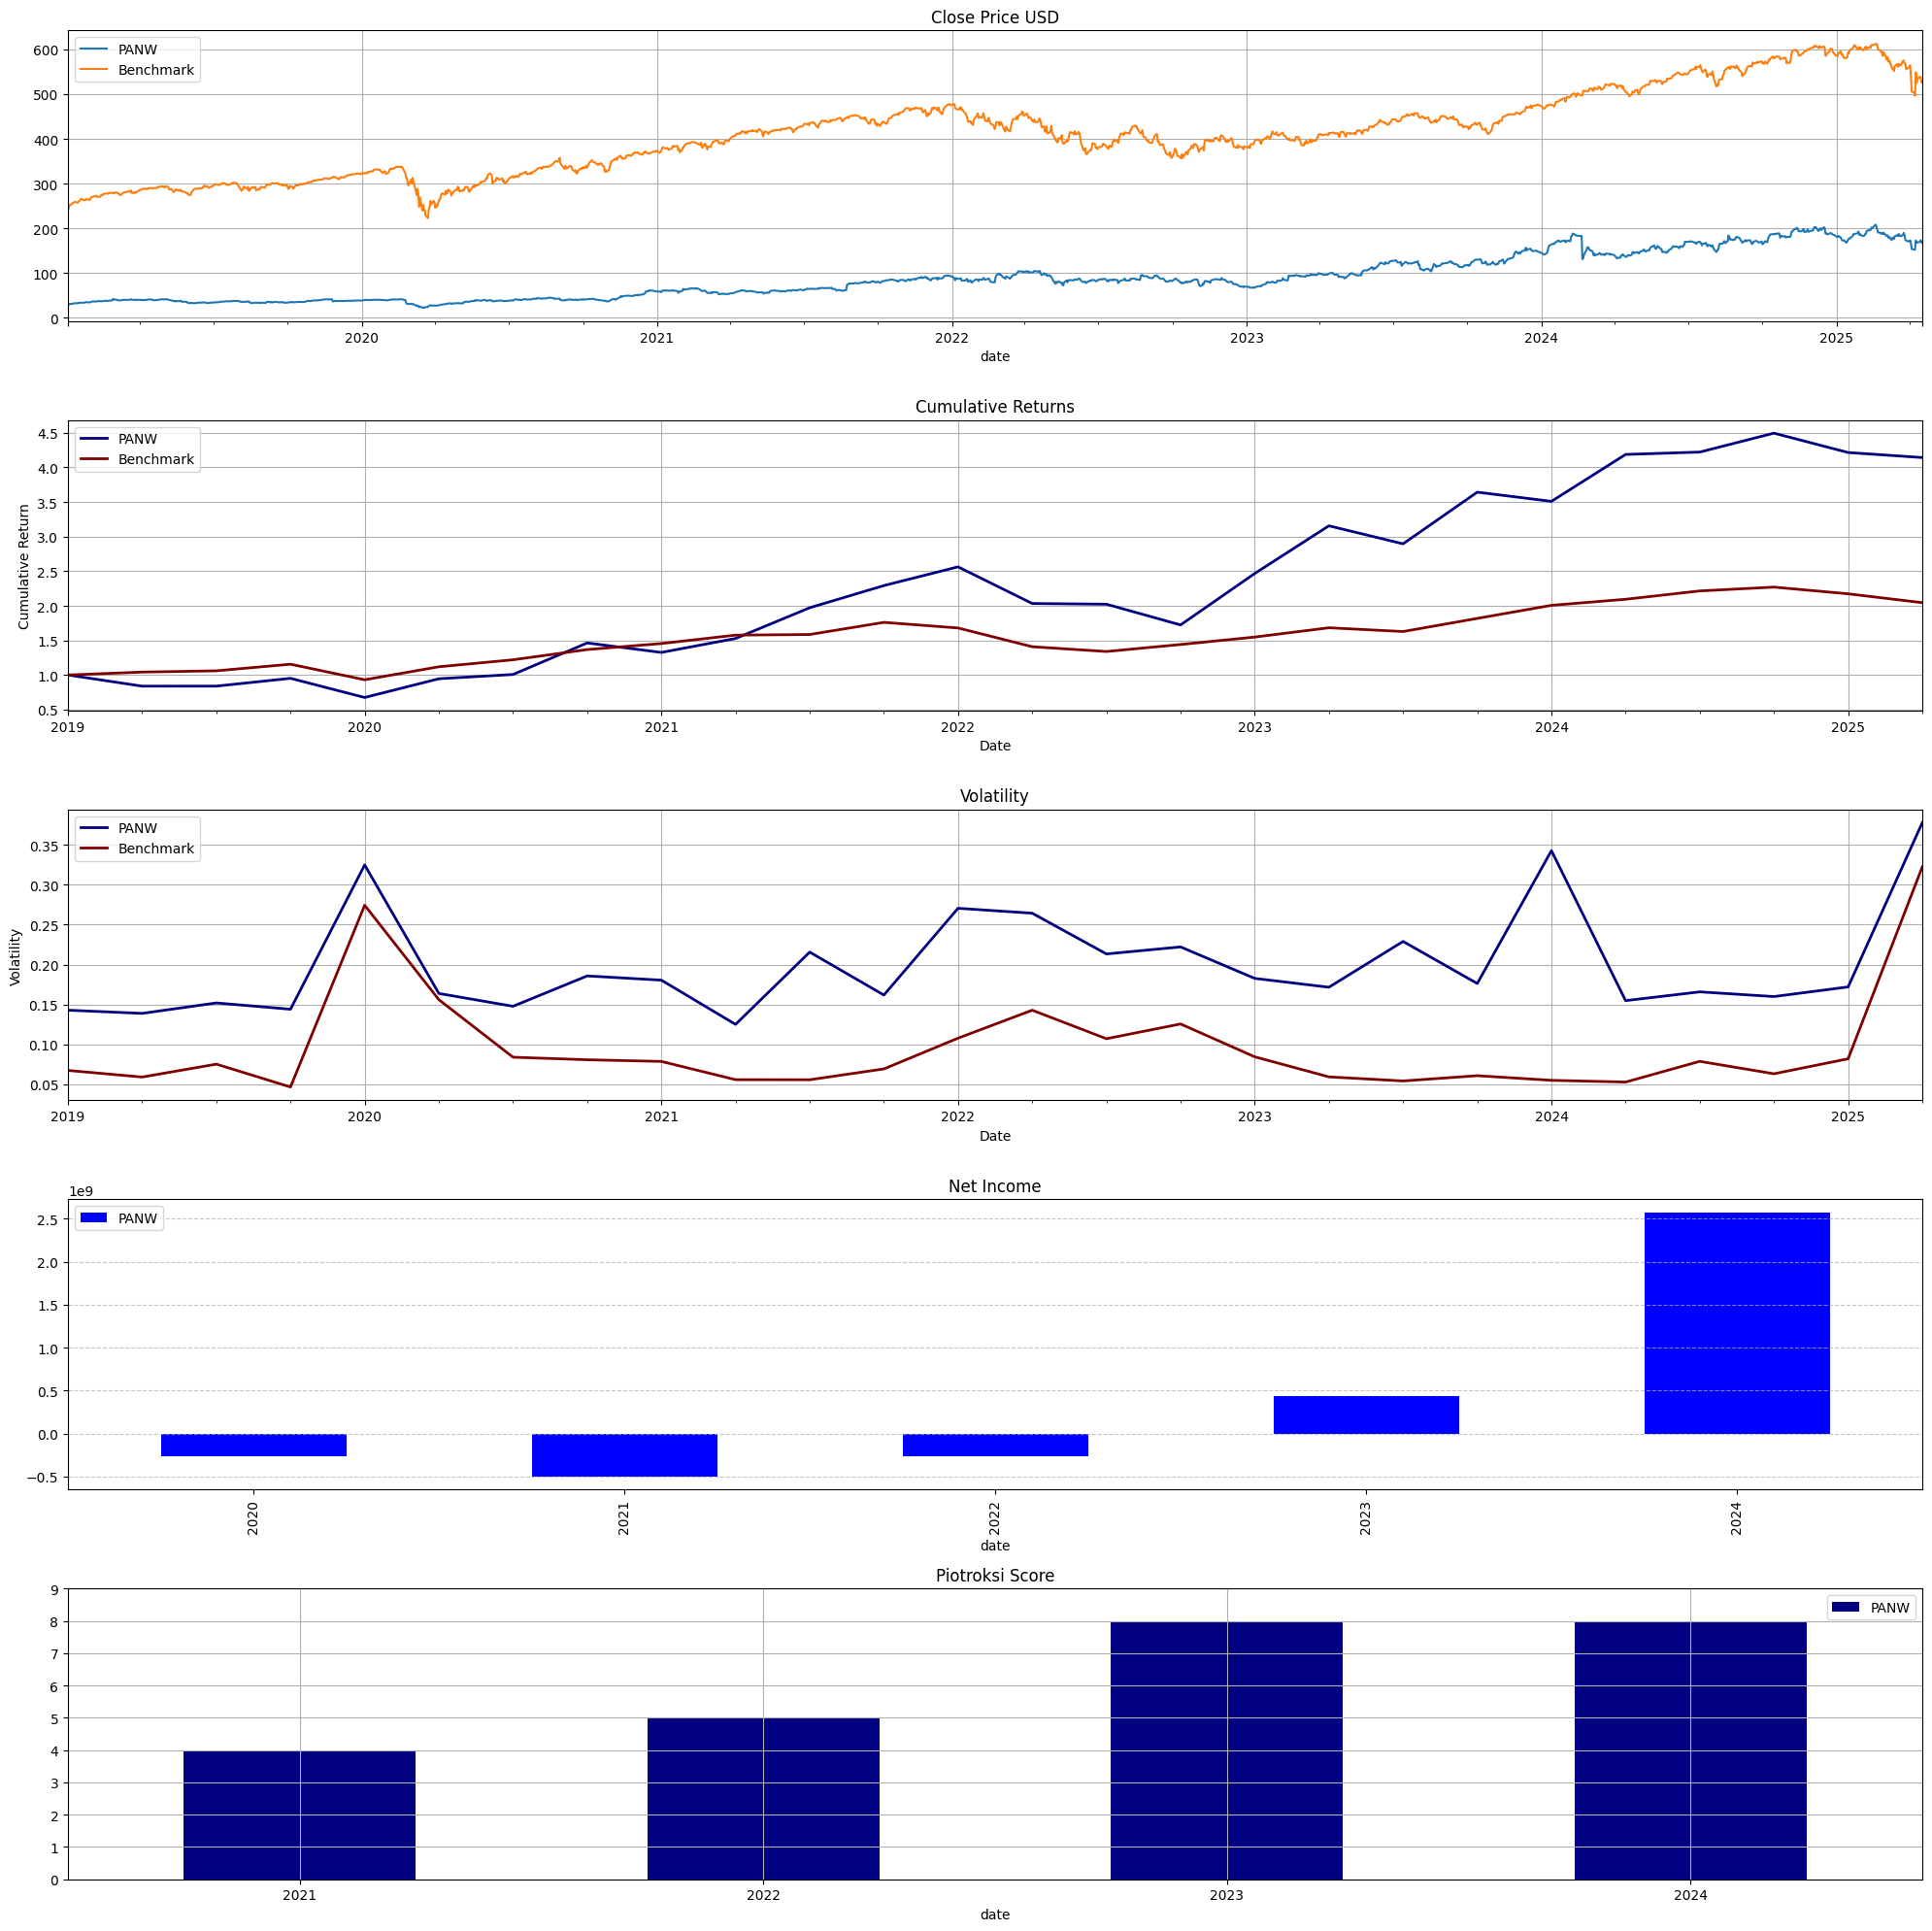
Statistics for PANW
Revenue
Net Income
Gross Margin %
Net Margin %
ROE %
ROA %
Loading ITables v2.3.0 from the init_notebook_mode cell...
(need help?)
Insights for PANW
ROE < 5.0%
Performance Details for PANW
15
Loading ITables v2.3.0 from the init_notebook_mode cell...
(need help?)
Maximum Drawdown for PANW
PANW
Benchmark
Loading ITables v2.3.0 from the init_notebook_mode cell...
(need help?)
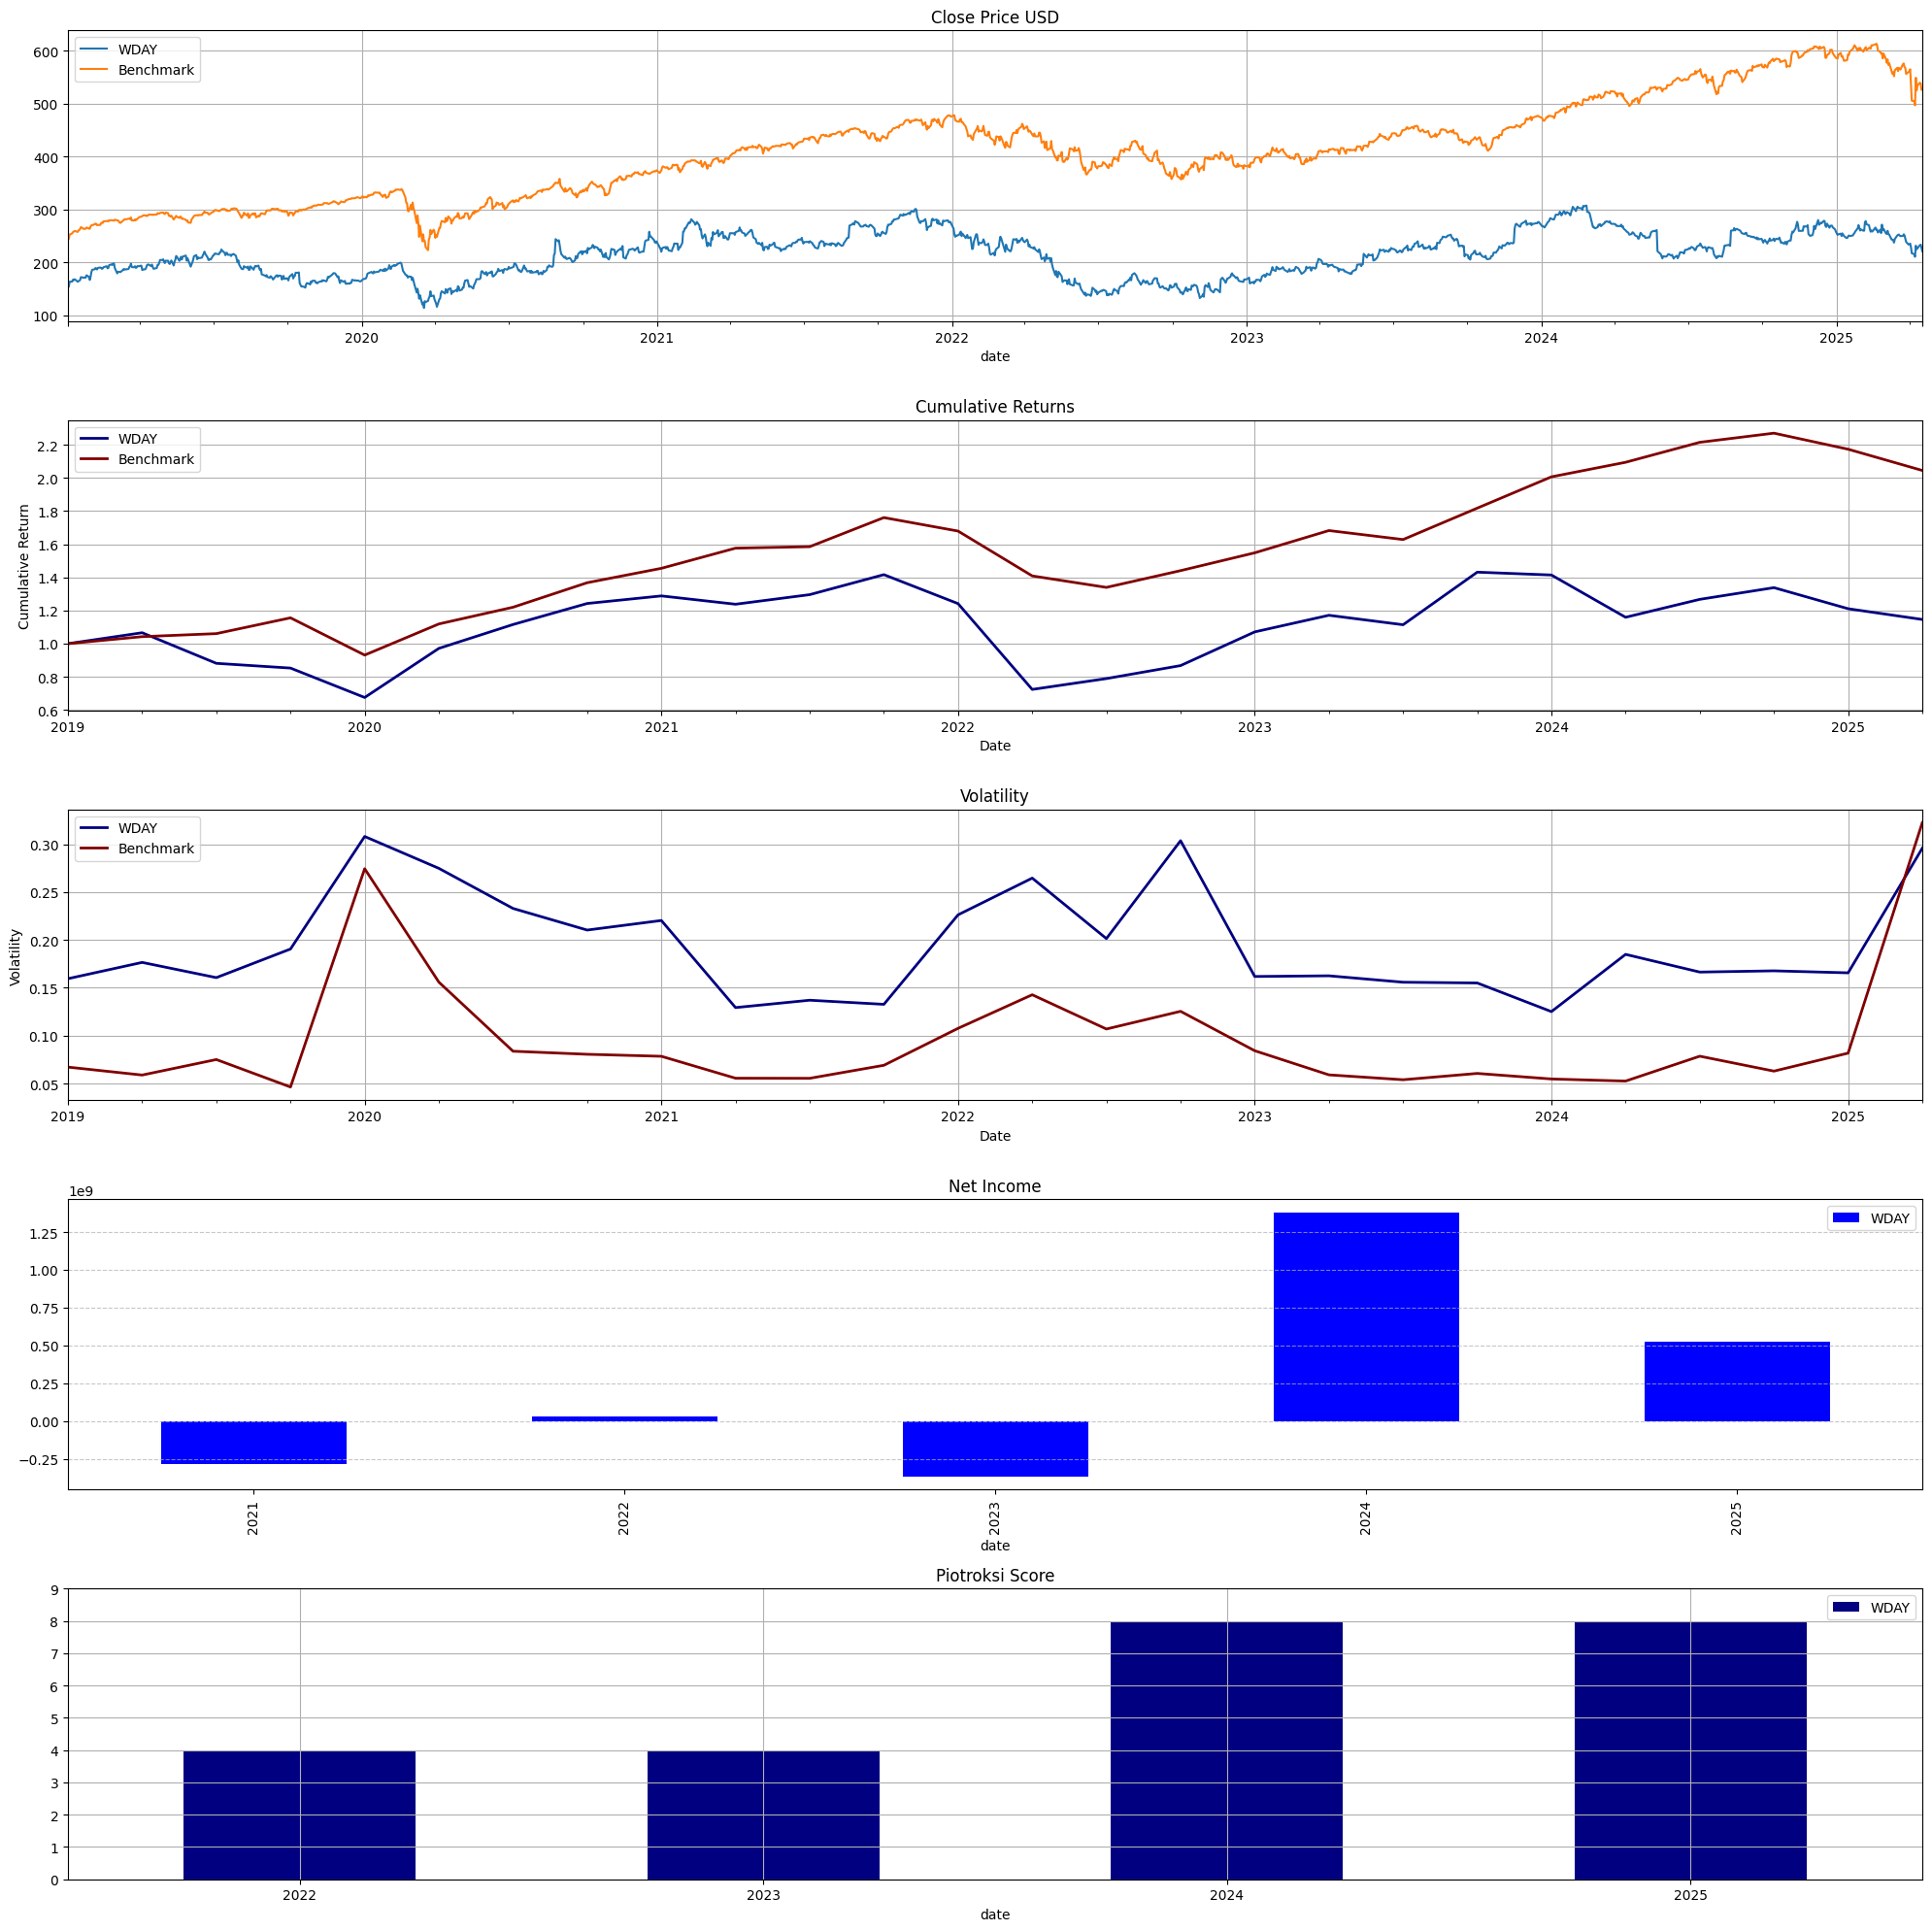
WDAY
Workday, Inc. (Services-Computer Processing & Data Preparation)
Fiscal year end : 0131 Report Date : 2025-01-31 Filing Date : 2025-03-11
WORKDAY, INC.Consolidated Balance Sheets 2025 2024 2023 2022
──────────────────────────────────────────────────────────────────────────────────────────────────────────────
Cash & Equivalents millions 1,543 2,012 1,886 1,534 Accounts Receivable millions 1,950 1,639 1,570 1,243 Total Current Assets millions 10,545 9,939 8,108 5,214 Property, Plant and Equipment millions 1,239 1,234 1,201 1,123 Goodwill millions 3,478 2,846 2,840 2,840 Other Assets millions 418 337 348 341 Total Assets millions 17,977 16,452 13,486 10,499 Accounts Payable millions 108 78 154 55 Total Current Liabilities millions 5,548 5,055 4,628 5,068 Long-term Liabilities millions 52 38 40 24 Total Liabilities millions 8,943 8,370 7,901 5,963 Commitments & Contingencies Other Comprehensive Income millions 84 21 53 8 Retained Earnings millions( 1,205)( 1,731)( 3,112)( 2,745) Total Stockholders' Equity millions 9,034 8,082 5,585 4,535 Total Liabilities & Equity millions 17,977 16,452 13,486 10,499
WORKDAY, INC.Income Statements 2025 2024 2023 2022 2021
───────────────────────────────────────────────────────────────────────────────────────────────────────────────────────────
Revenue millions 728 656 649 593 4,318 Cost of Sales millions 803 740 703 796 Research & Development millions 2,626 2,464 2,247 1,879 1,721 Total Operating Expenses millions ( 8,031)( 7,076)( 6,438)( 5,255)( 4,567)Operating Income millions 415 183( 222)( 116)( 249)Pre-tax Income millions 638 356( 260) 16( 275)Income Tax millions ( 112)( 1,025)( 107)( 13)( 7)Net Income millions 526 1,381( 367) 29( 282)EPS Basic 1.98 5.28( 1.44) 0.12( 1.19)EPS Diluted 1.95 5.21( 1.44) 0.12( 1.19)Shares Basic thousands 265,257 261,344 254,819 247,249 237,019Shares Diluted thousands 269,205 265,285 254,819 254,032 237,019
WORKDAY, INC.Consolidated Statement of Cash Flows 2025 2024 2023 2022 2021
────────────────────────────────────────────────────────────────────────────────────────────────────────────────────────
Stock-based Compensation millions 1,519 1,416 1,295 1,101 1,005 Net Cash from Operations millions 2,461 2,149 1,657 1,651 1,268 Capital Expenditures millions( 269)( 232)( 364) Net Cash from Investing millions( 1,781)( 1,751)( 2,506)( 1,607) Stock Repurchases millions( 700)( 423)( 75) -0 Net Cash from Financing millions( 1,150)( 268) 1,204 110Net Change in Cash millions( 470) 129 354 153Total Cash and Equivalents millions 1,554 2,024 1,895 1,541
Statistics for WDAY
Revenue
Net Income
Gross Margin %
Net Margin %
ROE %
ROA %
Loading ITables v2.3.0 from the init_notebook_mode cell...
(need help?)
Insights for WDAY
Net margin below 0.0% (negative)
Performance Details for WDAY
16
Loading ITables v2.3.0 from the init_notebook_mode cell...
(need help?)
Maximum Drawdown for WDAY
WDAY
Benchmark
Loading ITables v2.3.0 from the init_notebook_mode cell...
(need help?)
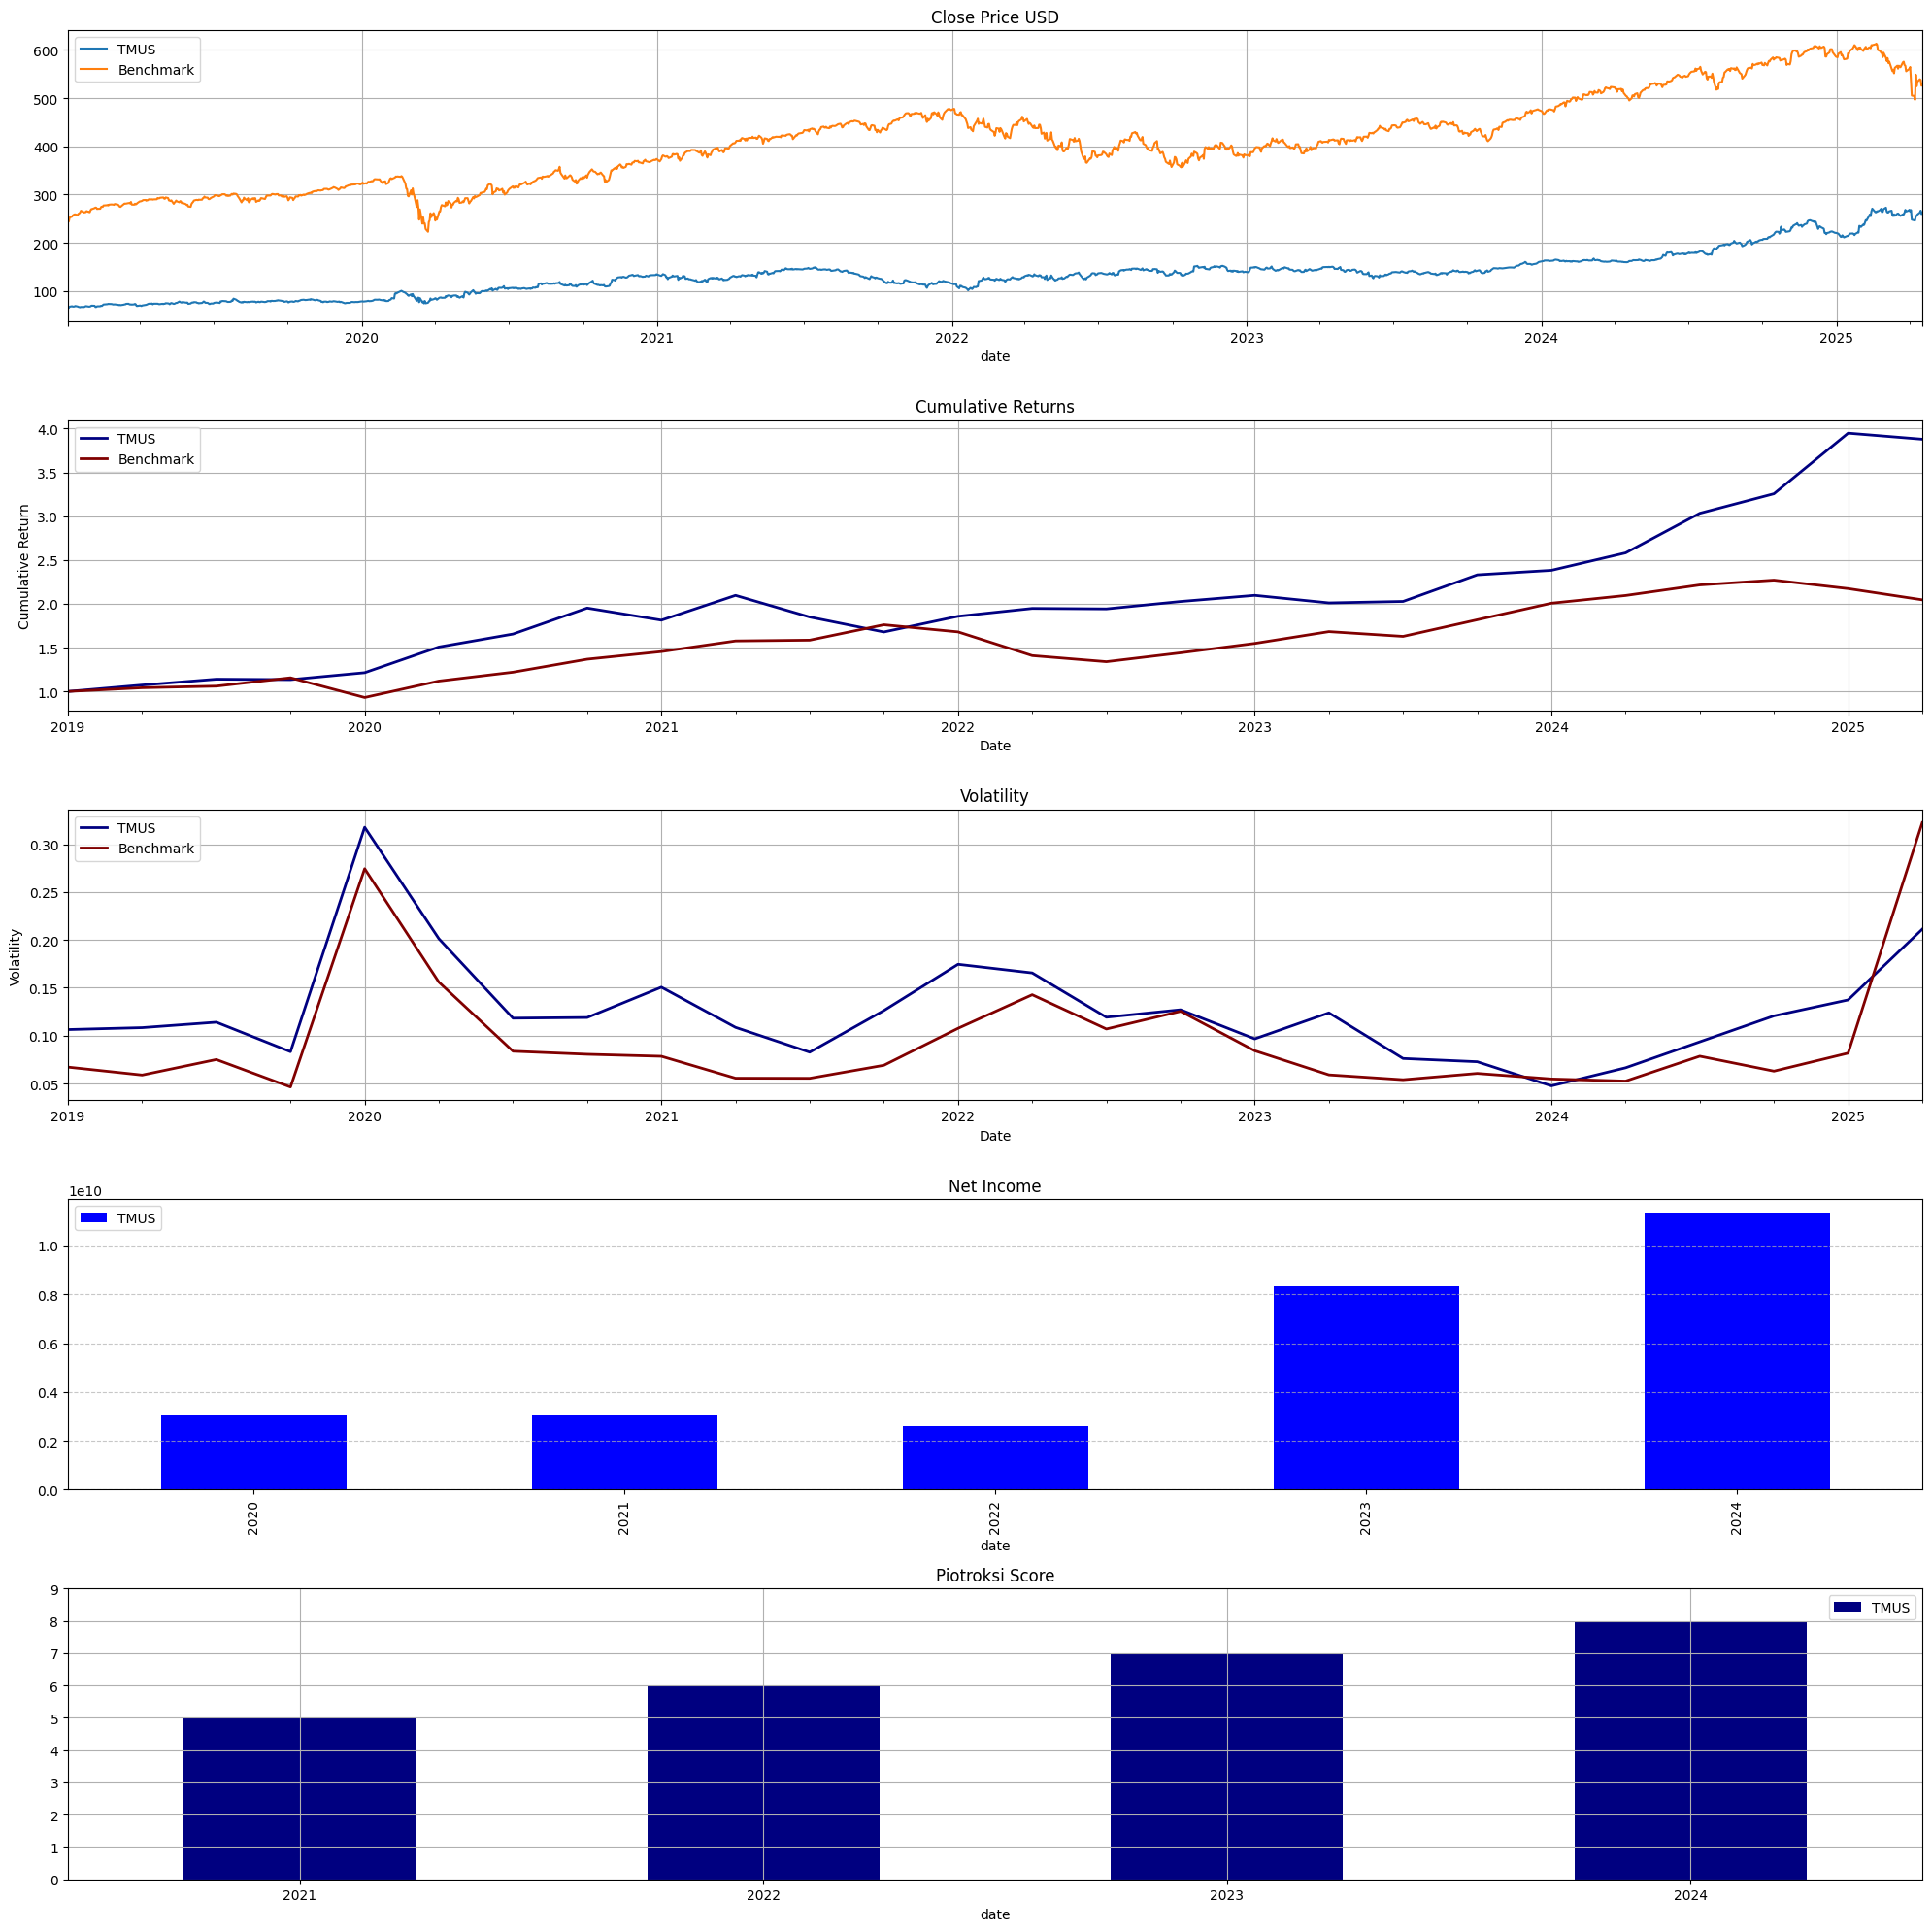
TMUS
T-Mobile US, Inc. (Radiotelephone Communications)
Fiscal year end : 1231 Report Date : 2024-12-31 Filing Date : 2025-01-31
T-MOBILE US, INC.Consolidated Balance Sheets 2024 2023 2022 2021
──────────────────────────────────────────────────────────────────────────────────────────────────────────────
Cash & Equivalents millions 5,409 5,135 4,507 6,631 Accounts Receivable millions 4,276 4,692 4,445 4,194 Inventory millions 1,607 1,678 1,884 2,567 Total Current Assets millions 18,404 19,015 19,067 20,891 Property, Plant and Equipment millions 38,533 40,432 42,086 39,803 Goodwill millions 13,005 12,234 12,234 12,188 Other Assets millions 4,325 4,229 4,127 3,232 Total Assets millions 208,035 207,682 211,338 206,563 Total Current Liabilities millions 20,174 20,928 24,742 23,499 Long-term Liabilities millions 4,000 3,929 4,101 5,097 Commitments & Contingencies Common Stock millions 0 0 0 0 Other Comprehensive Income millions( 857)( 964)( 1,046)( 1,365) Retained Earnings millions 14,384 7,347( 223)( 2,812) Total Stockholders' Equity millions 61,741 64,715 69,656 69,102 Total Liabilities & Equity millions 208,035 207,682 211,338 206,563
T-MOBILE US, INC.Income Statements 2024 2023 2022 2021 2020
─────────────────────────────────────────────────────────────────────────────────────────────────────────────────────────────────────────
Revenue millions 81,400 78,558 79,571 58,369 68,397 Cost of Sales Selling, General & Admin millions 20,818 21,311 21,607 20,238 18,926Operating Income millions 18,010 14,266 6,543 6,892 6,636Pre-tax Income millions 14,712 10,999 3,146 3,351 3,530Income Tax millions ( 3,373) ( 2,682) ( 556) ( 327) ( 786)Net Income millions 11,339 8,317 2,590 3,024 3,064 EPS Basic 9.7 7.02 2.07 2.42 2.68 EPS Diluted 9.66 6.93 2.06 2.41 2.65 Shares Basic 1,169,195,3731,185,121,5621,249,763,9341,247,154,9881,144,206,326 Shares Diluted 1,173,213,8981,200,286,2641,255,376,7691,254,769,9261,154,749,428
T-MOBILE US, INC.Consolidated Statement of Cash Flows 2024 2023 2022 2021 2020
──────────────────────────────────────────────────────────────────────────────────────────────────────────────────────────
Stock-based Compensation millions 649 667 595 540 694 Inventories millions( 131)( 197)( 744)( 201)( 2,222) Net Cash from Operations millions 22,293 18,559 16,781 13,917 8,640 Capital Expenditures millions( 8,840)( 9,801)( 13,970)( 12,326)( 11,034) Net Cash from Investing millions( 9,072)( 5,829)( 12,359)( 19,386)( 12,715) Stock Repurchases millions( 11,228)( 13,074)( 3,000) -0( 19,536) Net Cash from Financing millions( 12,815)( 12,097)( 6,451) 1,709 13,010Net Change in Cash millions 406 633( 2,029)( 3,760) 8,935 Total Cash and Equivalents millions 5,713 5,307 4,674 6,703 10,463Available durations for this statement:1 MonthAnnual
Statistics for TMUS
Revenue
Net Income
Gross Margin %
Net Margin %
ROE %
ROA %
Loading ITables v2.3.0 from the init_notebook_mode cell...
(need help?)
Loading ITables v2.3.0 from the init_notebook_mode cell...
(need help?)
Maximum Drawdown for TMUS
TMUS
Benchmark
Loading ITables v2.3.0 from the init_notebook_mode cell...
(need help?)
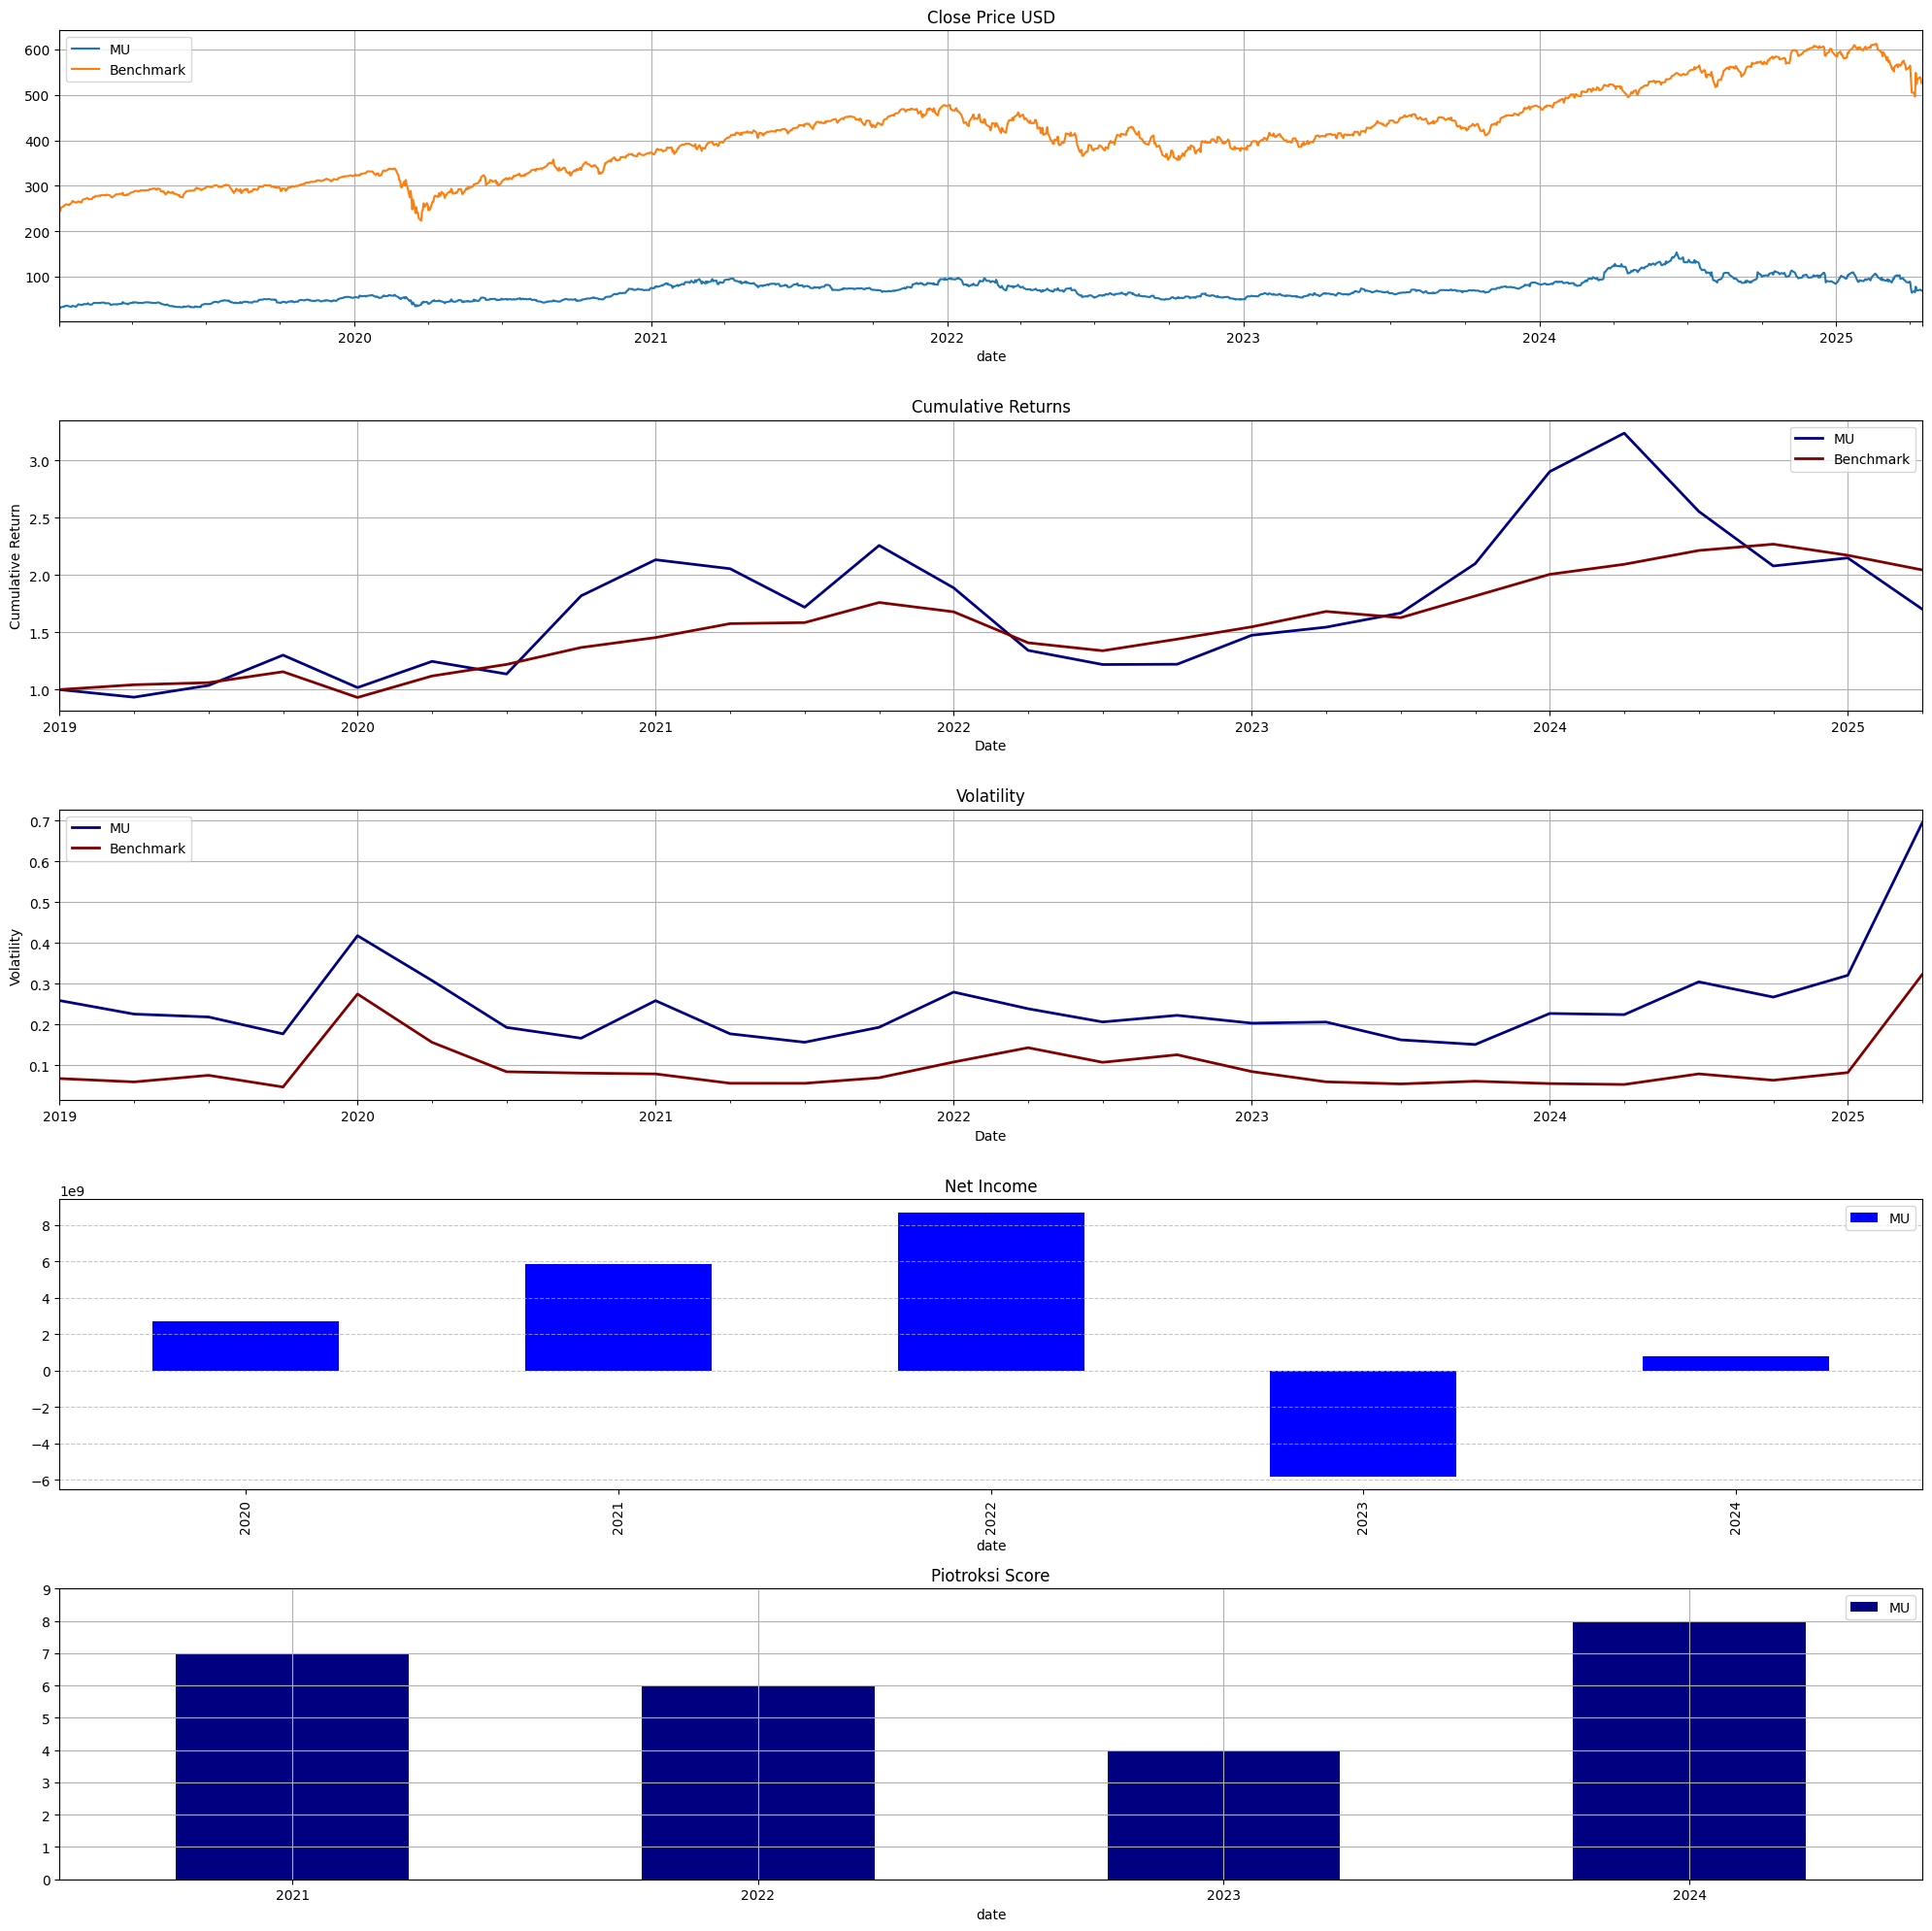
MU
MICRON TECHNOLOGY INC (Semiconductors & Related Devices)
Fiscal year end : 0828 Report Date : 2024-08-29 Filing Date : 2024-10-04
Micron Technology, Inc.Consolidated Balance Sheets 2024 2023 2022 2021
────────────────────────────────────────────────────────────────────────────────────────────────────────────
Cash & Equivalents millions 7,041 8,577 8,262 7,763 Inventory millions 8,875 8,387 6,663 4,487 Total Current Assets millions 24,372 21,244 21,781 19,907 Goodwill millions 1,150 1,150 1,228 1,228 Other Assets millions 1,518 1,262 1,277 1,054 Total Assets millions 69,416 64,254 66,283 58,849 Total Current Liabilities millions 9,248 4,765 7,539 6,424 Long-term Liabilities millions 911 987 835 559 Total Liabilities millions 24,285 20,134 16,376 14,916 Commitments & Contingencies Common Stock millions 125 124 123 122 Retained Earnings millions 40,877 40,824 47,274 39,051 Other Comprehensive Income millions( 134)( 312)( 560) 2 Total Stockholders' Equity millions 45,131 44,120 49,907 43,933 Total Liabilities & Equity millions 69,416 64,254 66,283 58,849
Micron Technology, Inc.Income Statements 2024 2023 2022 2021 2020
──────────────────────────────────────────────────────────────────────────────────────────────────────────────────────────
Revenue millions 25,111 15,540 30,758 27,705 21,435Cost of Sales millions( 19,498)( 16,956)( 16,860)( 17,282)( 14,883)Research & Development millions( 3,430)( 3,114)( 3,116)( 2,663)( 2,600)Selling, General & Admin millions( 1,129)( 920)( 1,066)( 894)( 881)Operating Income millions 1,304( 5,745) 9,702 6,283 3,003Income Tax millions( 451)( 177)( 888)( 394)( 280)Net Income millions 778( 5,833) 8,687 5,861 2,687 EPS Basic 0.7( 5.34) 7.81 5.23 2.42 EPS Diluted 0.7( 5.34) 7.75 5.14 2.37 Shares Basic millions 1,105 1,093 1,112 1,120 1,110 Shares Diluted millions 1,118 1,093 1,122 1,141 1,131
Micron Technology, Inc.Consolidated Statement of Cash Flows 2024 2023 2022 2021 2020
──────────────────────────────────────────────────────────────────────────────────────────────────────────────────────────
Stock-based Compensation millions 833 596 514 378 328 Inventories millions( 488)( 3,555)( 2,179)( 866)( 435) Net Cash from Operations millions 8,507 1,559 15,181 12,468 8,306 Capital Expenditures millions( 8,386)( 7,676)( 12,067)( 10,030)( 8,223) Net Cash from Investing millions( 8,309)( 6,191)( 11,585)( 10,589)( 7,589) Stock Repurchases millions( 300)( 425)( 2,432)( 1,200)( 176) Net Cash from Financing millions( 1,842) 4,983( 2,980)( 1,781)( 317)Net Change in Cash millions( 1,604) 317 510 139 411Total Cash and Equivalents millions 7,052 8,656 8,339 7,829 7,690Available durations for this statement:5 Years 11 MonthsAnnual
Statistics for MU
Revenue
Net Income
Gross Margin %
Net Margin %
ROE %
ROA %
Loading ITables v2.3.0 from the init_notebook_mode cell...
(need help?)
Performance Details for MU
18
Loading ITables v2.3.0 from the init_notebook_mode cell...
(need help?)
Maximum Drawdown for MU
MU
Benchmark
Loading ITables v2.3.0 from the init_notebook_mode cell...
(need help?)
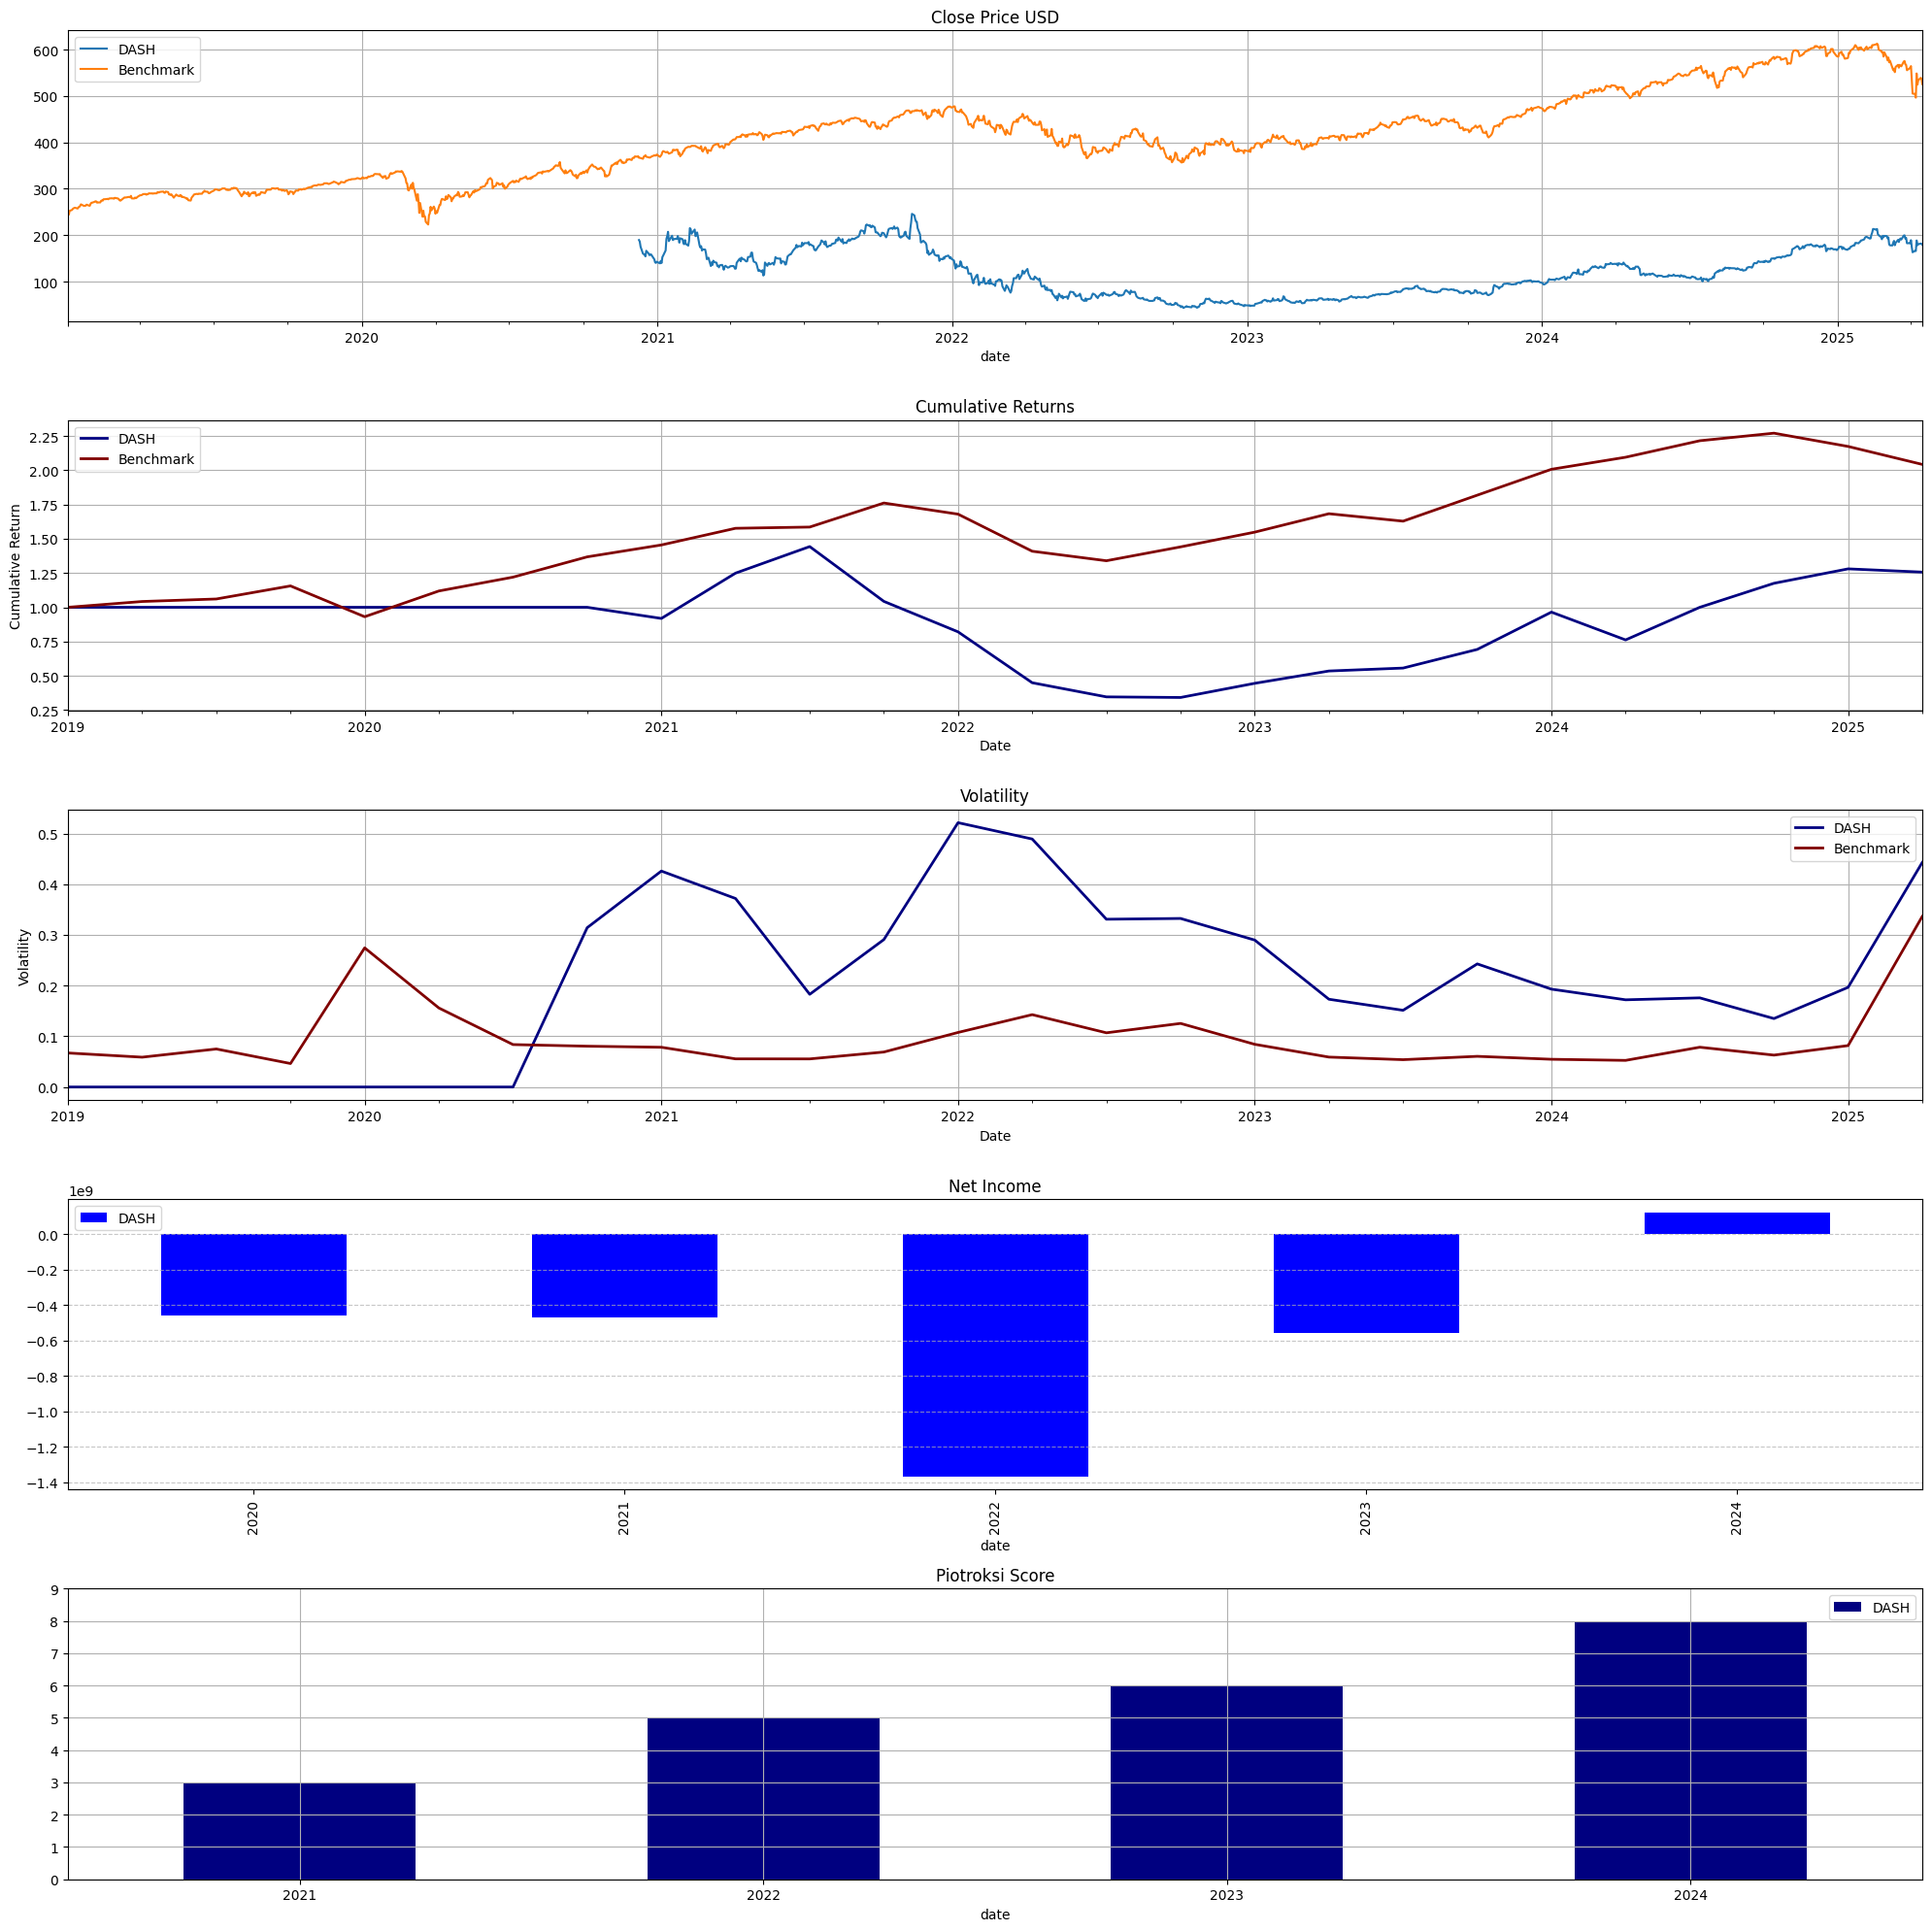
DASH
DoorDash, Inc. (Services-Business Services, NEC)
Fiscal year end : 1231 Report Date : 2024-12-31 Filing Date : 2025-02-14
DOORDASH, INC.Consolidated Balance Sheets 2024 2023 2022 2021 2020
────────────────────────────────────────────────────────────────────────────────────────────────────────────────────────
Cash & Equivalents millions 4,019 2,656 1,977 2,504 4,345 Accounts Receivable millions 732 533 400 349 Total Current Assets millions 7,386 5,597 4,720 4,565 Goodwill millions 2,315 2,432 2,370 316 316 Other Assets millions 632 420 129 68 Total Assets millions 12,845 10,839 9,789 6,809 Accounts Payable millions 321 216 157 161 Total Current Liabilities millions 4,438 3,410 2,544 1,760 Long-term Liabilities millions 129 162 21 9 Total Liabilities millions 5,035 4,026 3,021 2,142 Commitments & Contingencies Common Stock millions 0 0 0 0 Other Comprehensive Income millions( 107) 73( 33)( 4) Retained Earnings millions( 5,255)( 5,154)( 3,846)( 2,081) Total Stockholders' Equity millions 7,803 6,806 6,754 4,667 4,700 Total Liabilities & Equity millions 12,845 10,839 9,789 6,809
DOORDASH, INC.Income Statements 2024 2023 2022 2021 2020
───────────────────────────────────────────────────────────────────────────────────────────────────────────────────────────
Revenue millions 10,722 8,635 6,583 4,888 2,886 Research & Development millions 1,168 1,003 829 430 321Operating Income millions ( 38)( 579)( 1,124)( 452)( 436)Pre-tax Income millions 156( 534)( 1,399)( 463)( 458)Income Tax millions ( 39)( 31)( 31)( 5)( 3)Net Income millions 123( 558)( 1,365)( 468)( 461) EPS Basic 0.3( 1.42)( 3.68)( 1.39)( 7.39) EPS Diluted 0.29( 1.42)( 3.68)( 1.39)( 7.39) Shares Basic thousands 411,551 392,948 371,413 336,847 62,390 Shares Diluted thousands 430,242 392,948 371,413 336,847 62,390
DOORDASH, INC.Consolidated Statement of Cash Flows 2024 2023 2022 2021 2020
──────────────────────────────────────────────────────────────────────────────────────────────────────────────────────────
Stock-based Compensation millions 1,099 1,088 889 486 322 Net Cash from Operations millions 2,132 1,673 367 692 252 Capital Expenditures millions( 104)( 123)( 176)( 129)( 106) Net Cash from Investing millions( 444)( 342)( 300)( 2,047)( 192) Stock Repurchases millions( 224)( 750)( 400) -0 -0 Net Cash from Financing millions( 204)( 752)( 375)( 483) 3,996Net Change in Cash millions 1,449 584( 318)( 1,839) 4,058Total Cash and Equivalents millions 4,221 2,772 2,188 2,506 4,345
Statistics for DASH
Revenue
Net Income
Gross Margin %
Net Margin %
ROE %
ROA %
Loading ITables v2.3.0 from the init_notebook_mode cell...
(need help?)
Insights for DASH
Net margin below 0.0% (negative)
Performance Details for DASH
19
Loading ITables v2.3.0 from the init_notebook_mode cell...
(need help?)
Maximum Drawdown for DASH
DASH
Benchmark
Loading ITables v2.3.0 from the init_notebook_mode cell...
(need help?)
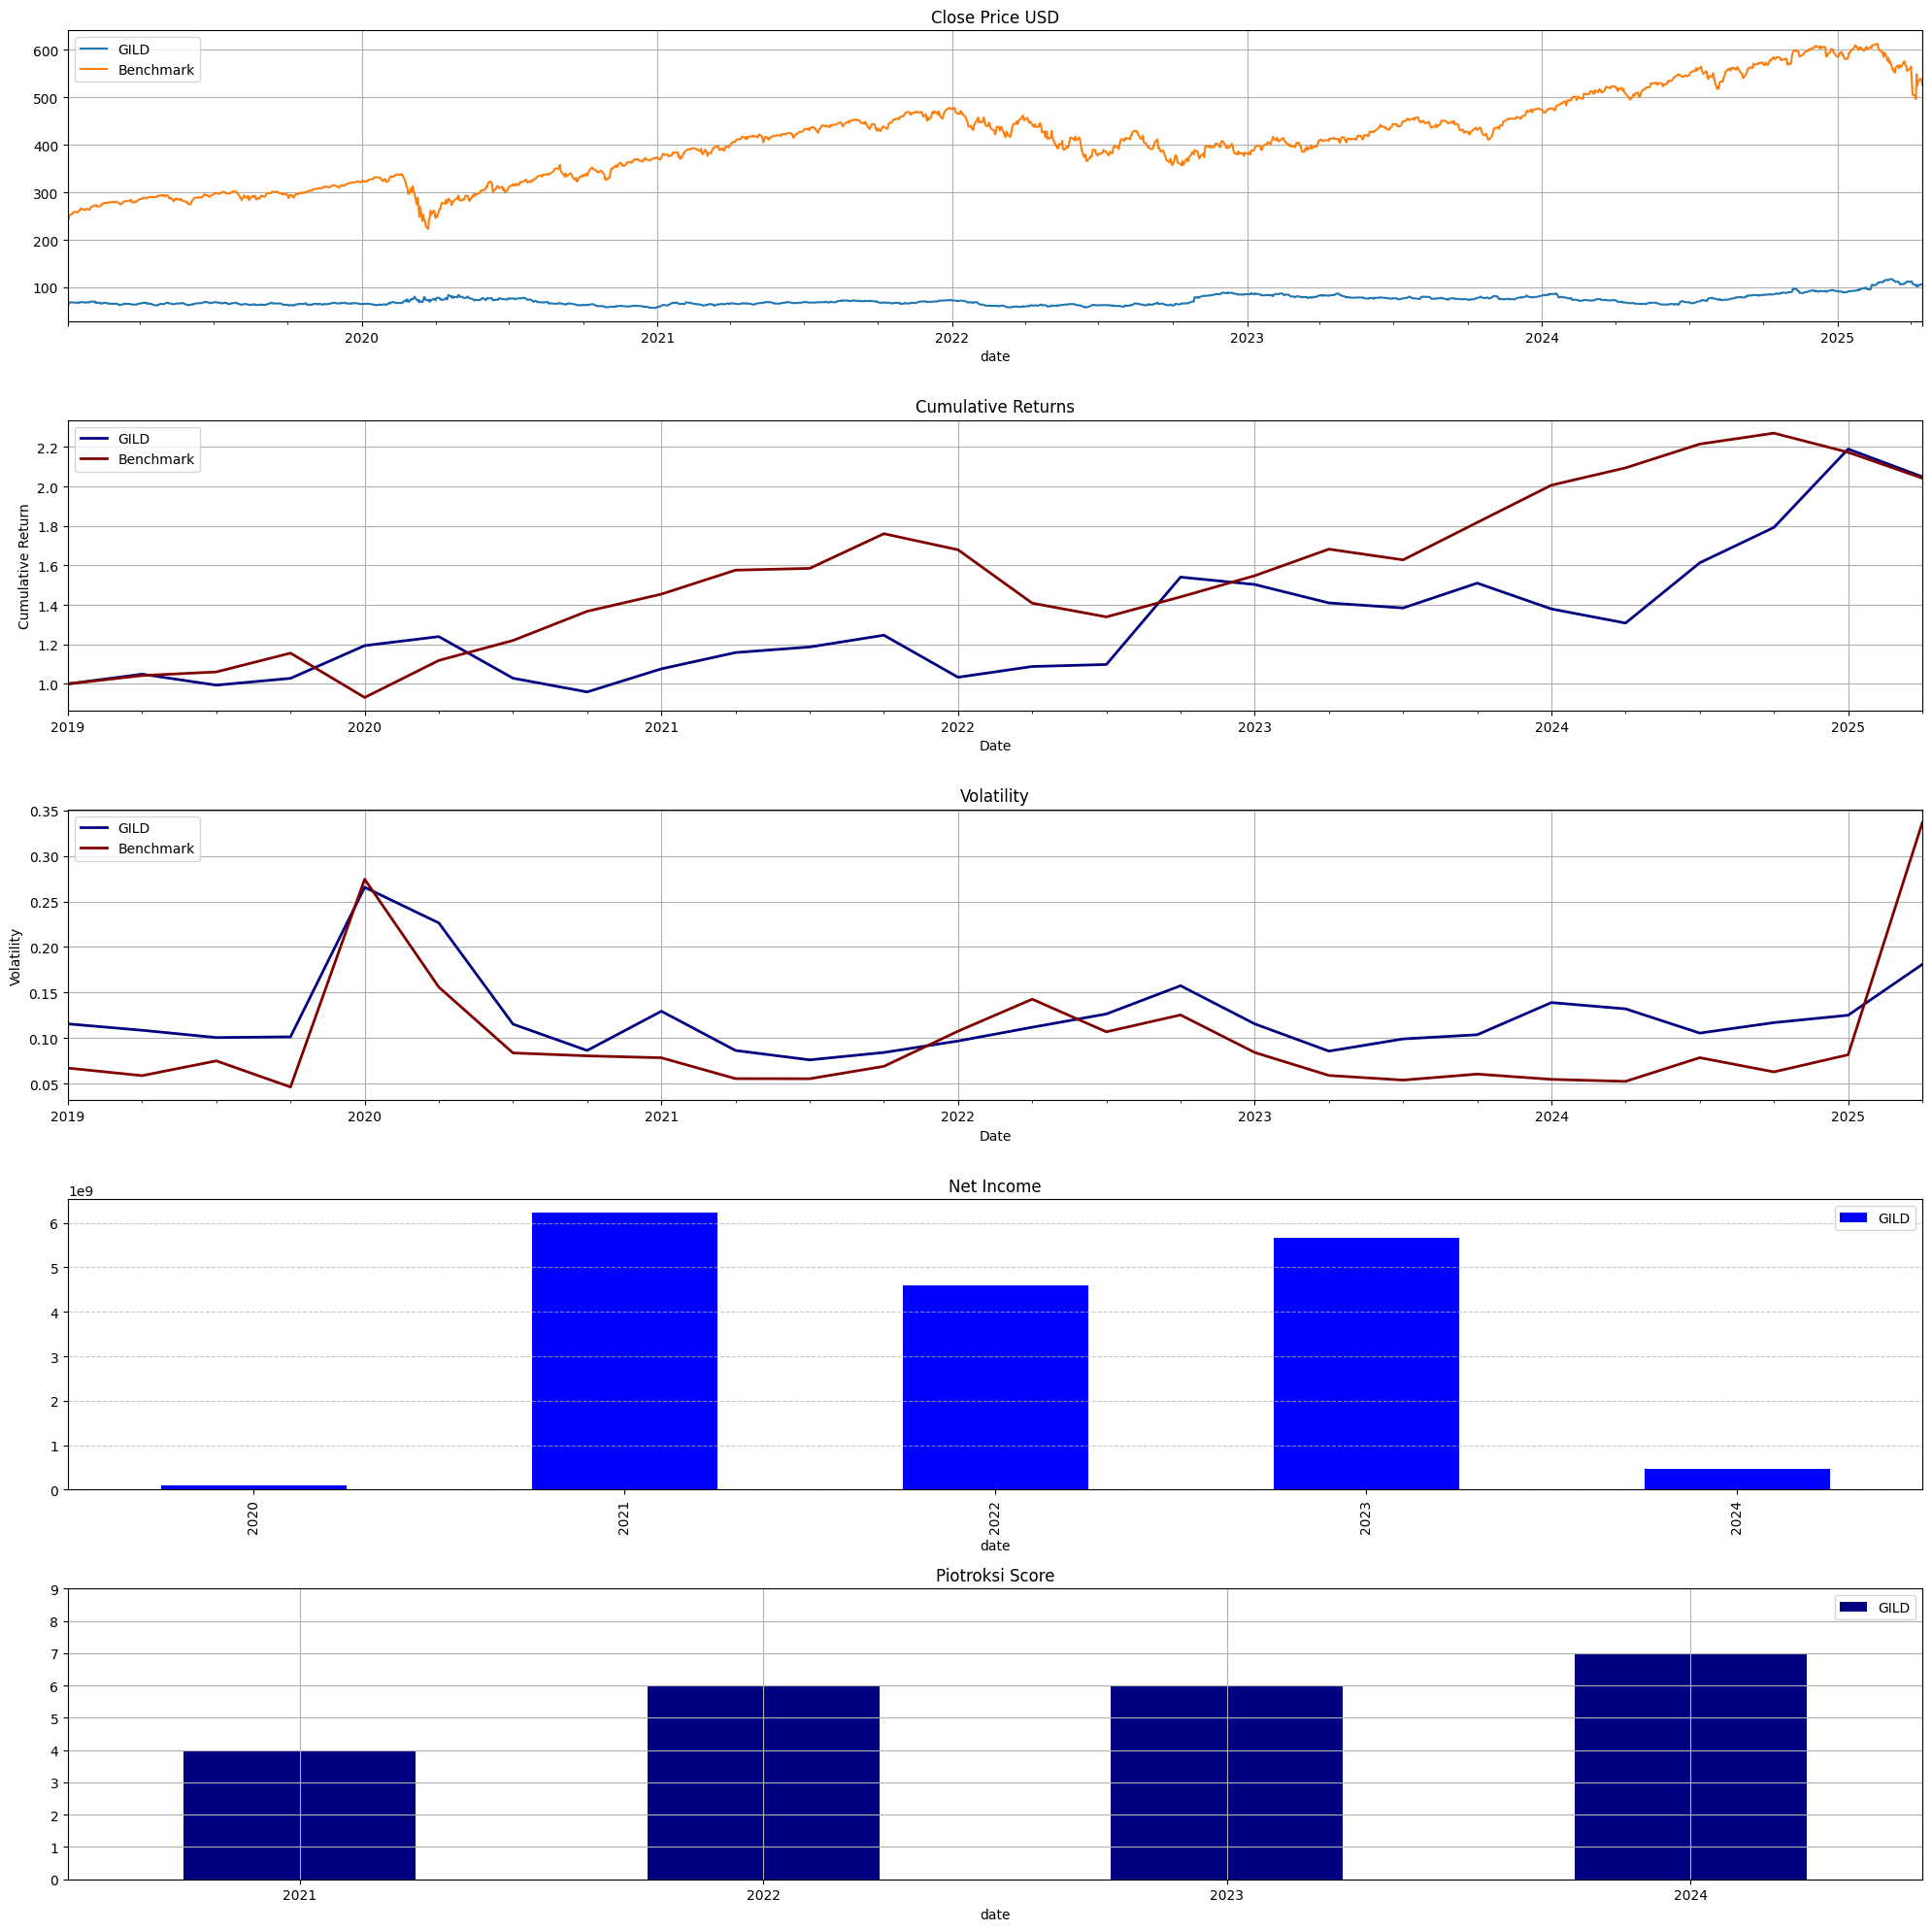
GILD
GILEAD SCIENCES, INC. (Biological Products, (No Diagnostic Substances))
Fiscal year end : 1231 Report Date : 2024-12-31 Filing Date : 2025-02-28
GILEAD SCIENCES, INC.Consolidated Balance Sheets 2024 2023 2022 2021
──────────────────────────────────────────────────────────────────────────────────────────────────────
Accounts Receivable millions 4,420 4,660 4,777 4,493 Inventory millions 1,710 1,787 1,507 1,618 Total Current Assets millions 19,173 16,085 14,443 14,772 Property, Plant and Equipment millions 5,414 5,317 5,475 5,121 Goodwill millions 8,314 8,314 8,314 8,332 Other Assets millions 6,146 4,792 4,800 4,963 Total Assets millions 58,995 62,125 63,171 67,952 Accounts Payable millions 833 550 905 705 Total Current Liabilities millions 12,004 11,280 11,237 11,610 Long-term Liabilities millions 1,295 1,280 1,179 976 Commitments & Contingencies Common Stock millions 1 1 1 1 Other Comprehensive Income millions 132 28 2 83 Retained Earnings millions 11,497 16,304 15,687 16,324 Total Stockholders' Equity millions 19,330 22,833 21,240 21,069 Total Liabilities & Equity millions 58,995 62,125 63,171 67,952 Cash & Equivalents millions 5,412 5,338
GILEAD SCIENCES, INC.Income Statements 2024 2023 2022 2021 2020
──────────────────────────────────────────────────────────────────────────────────────────────────────────────────────────
Revenue millions 28,754 27,116 27,281 297 24,689 Cost of Sales millions 6,251 6,498 5,657 6,601 4,572 Selling, General & Admin millions 6,091 6,090 5,673 5,246 5,151Operating Income millions 1,662 7,605 7,330 9,918 4,071Pre-tax Income millions 690 6,859 5,814 8,278 1,669Income Tax millions( 211)( 1,247)( 1,248)( 2,077)( 1,580)Net Income millions 480 5,665 4,592 6,225 123EPS Basic 0.38 4.54 3.66 4.96 0.1Shares Basic millions 1,247 1,248 1,255 1,256 1,257EPS Diluted 0.38 4.5 3.64 4.93 0.1Shares Diluted millions 1,255 1,258 1,262 1,262 1,263Available durations for this statement:1 Month3 MonthsAnnual
GILEAD SCIENCES, INC.Consolidated Statement of Cash Flows 2024 2023 2022 2021 2020
──────────────────────────────────────────────────────────────────────────────────────────────────────────────────────────
Stock-based Compensation millions 835 766 637 635 643 Inventories millions( 426)( 842)( 310)( 11)( 195) Net Cash from Operations millions 10,828 8,006 9,072 11,384 8,168 Capital Expenditures millions( 523)( 585)( 728)( 579)( 650) Net Cash from Investing millions( 3,449)( 2,265)( 2,466)( 3,131)( 14,615) Stock Repurchases millions( 1,150)( 1,000)( 1,396)( 546)( 1,583) Net Cash from Financing millions( 3,433)( 5,125)( 6,469)( 8,877) 770Net Change in Cash millions 3,906 673 74( 659)( 5,634)Total Cash and Equivalents millions 9,991 6,085 5,412 5,338 5,997Available durations for this statement:1 Month3 MonthsAnnual
Statistics for GILD
Revenue
Net Income
Gross Margin %
Net Margin %
ROE %
ROA %
Loading ITables v2.3.0 from the init_notebook_mode cell...
(need help?)
Performance Details for GILD
20
Loading ITables v2.3.0 from the init_notebook_mode cell...
(need help?)
Maximum Drawdown for GILD
GILD
Benchmark
Loading ITables v2.3.0 from the init_notebook_mode cell...
(need help?)
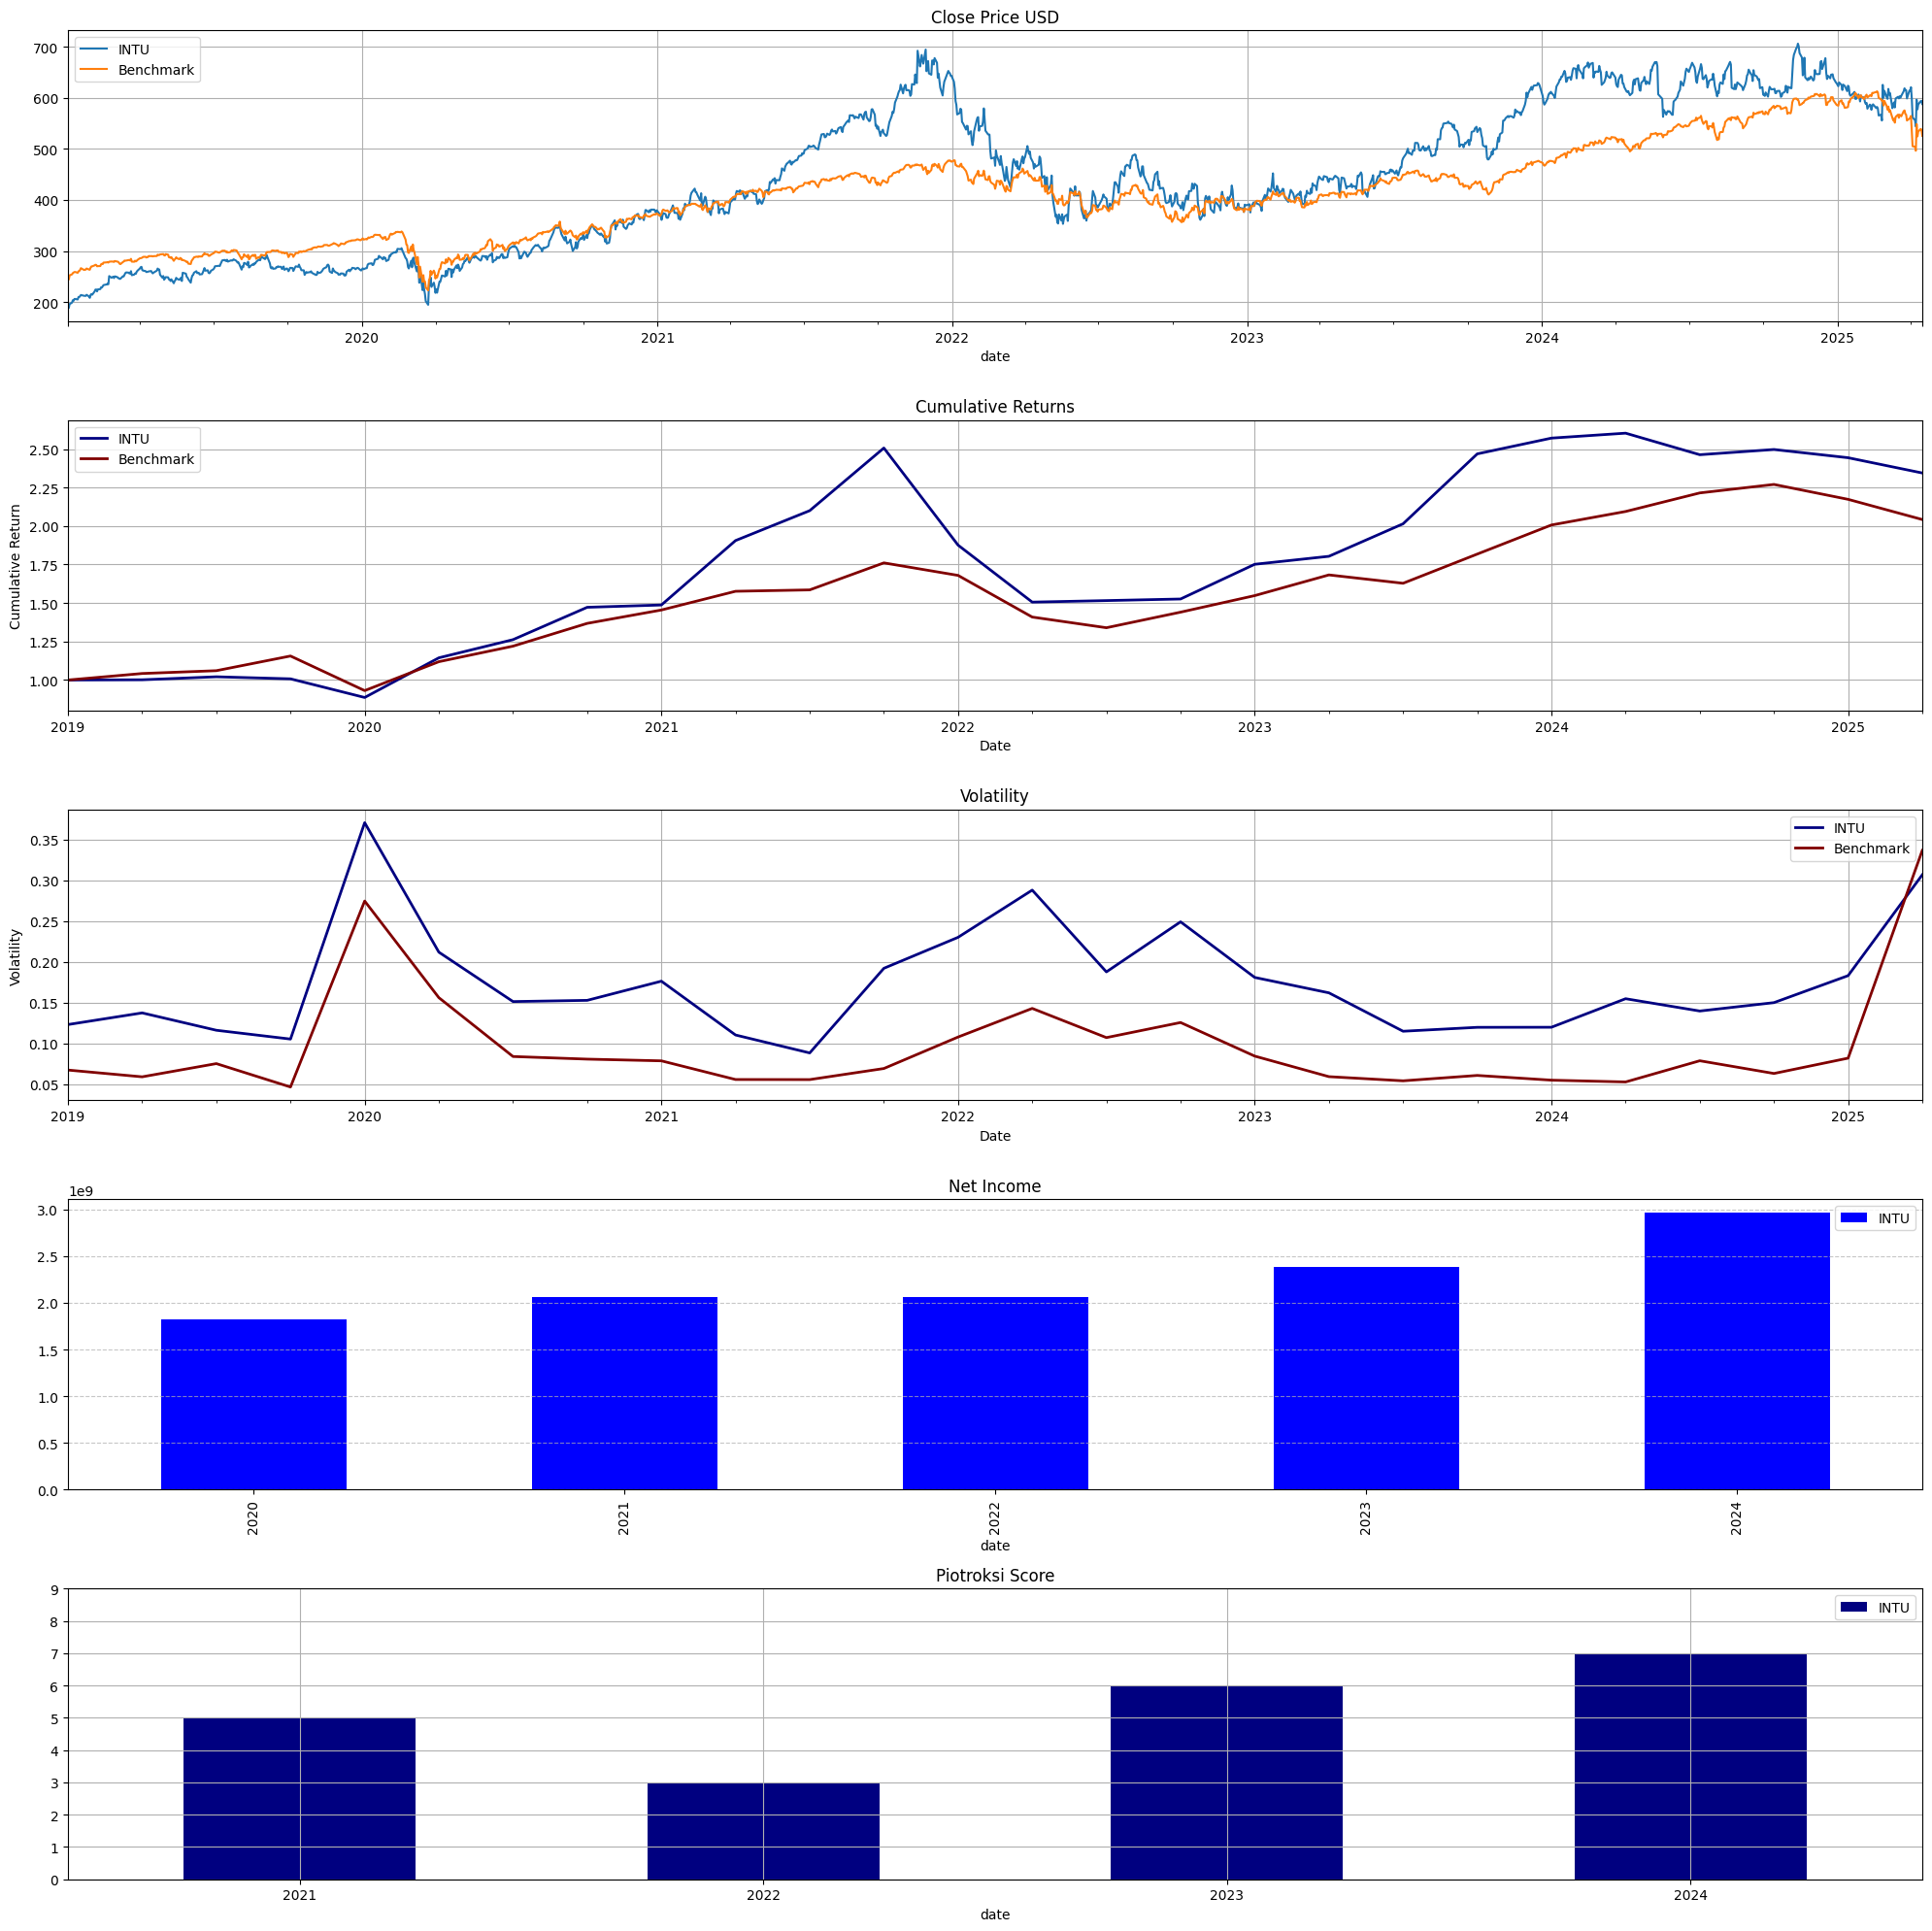
INTU
INTUIT INC. (Services-Prepackaged Software)
Fiscal year end : 0731 Report Date : 2024-07-31 Filing Date : 2024-09-04
INTUIT INC.Consolidated Balance Sheets 2024 2023 2022 2021 2020
────────────────────────────────────────────────────────────────────────────────────────────────────────────────────────
Cash & Equivalents millions 3,609 2,848 2,796 2,562 6,442 Accounts Receivable millions 457 405 446 391 Total Current Assets millions 9,678 5,557 5,047 5,157 Property, Plant and Equipment millions 1,009 969 888 780 Goodwill millions 13,844 13,780 13,736 5,613 1,654 Other Assets millions 541 417 344 283 Total Assets millions 32,132 27,780 27,734 15,516 Accounts Payable millions 721 638 737 623 Total Current Liabilities millions 7,491 3,790 3,630 2,655 Long-term Liabilities millions 208 121 87 53 Total Liabilities millions 13,696 10,511 11,293 5,647 Commitments & Contingencies Common Stock millions 3 3 3 3 Other Comprehensive Income millions( 54)( 55)( 60)( 24) Retained Earnings millions 16,989 15,067 13,581 12,296 Total Stockholders' Equity millions 18,436 17,269 16,441 9,869 5,106 Total Liabilities & Equity millions 32,132 27,780 27,734 15,516
INTUIT INC.Income Statements 2024 2023 2022 2021 2020
──────────────────────────────────────────────────────────────────────────────────────────────────────────────────────────
Cost of Sales Research & Development millions 2,754 2,539 2,347 1,678 1,392Operating Income millions 3,630 3,141 2,571 2,500 2,176Pre-tax Income millions 3,550 2,989 2,542 2,556 2,198Income Tax millions( 587)( 605)( 476)( 494)( 372)Net Income millions 2,963 2,384 2,066 2,062 1,826EPS Basic 10.58 8.49 7.38 7.65 6.99Shares Basic millions 280 281 280 270 261EPS Diluted 10.43 8.42 7.28 7.56 6.92Shares Diluted millions 284 283 284 273 264
INTUIT INC.Consolidated Statement of Cash Flows 2024 2023 2022 2021 2020
──────────────────────────────────────────────────────────────────────────────────────────────────────────────────────────
Stock-based Compensation millions 1,940 1,712 1,308 753 435 Net Cash from Operations millions 4,884 5,046 3,889 3,250 2,414 Capital Expenditures millions( 191)( 210)( 157)( 53)( 59) Net Cash from Investing millions( 227)( 922)( 5,421)( 3,965)( 97) Stock Repurchases millions( 1,988)( 1,967)( 1,861)( 1,005)( 323) Net Cash from Financing millions( 397)( 4,269) 1,732( 3,176) 2,034Net Change in Cash millions 4,247( 145) 178( 3,878) 4,345Total Cash and Equivalents millions 7,099 2,852 2,997 2,819 6,697
Statistics for INTU
Revenue
Net Income
Gross Margin %
Net Margin %
ROE %
ROA %
Loading ITables v2.3.0 from the init_notebook_mode cell...
(need help?)
Performance Details for INTU
21
Loading ITables v2.3.0 from the init_notebook_mode cell...
(need help?)
Maximum Drawdown for INTU
INTU
Benchmark
Loading ITables v2.3.0 from the init_notebook_mode cell...
(need help?)
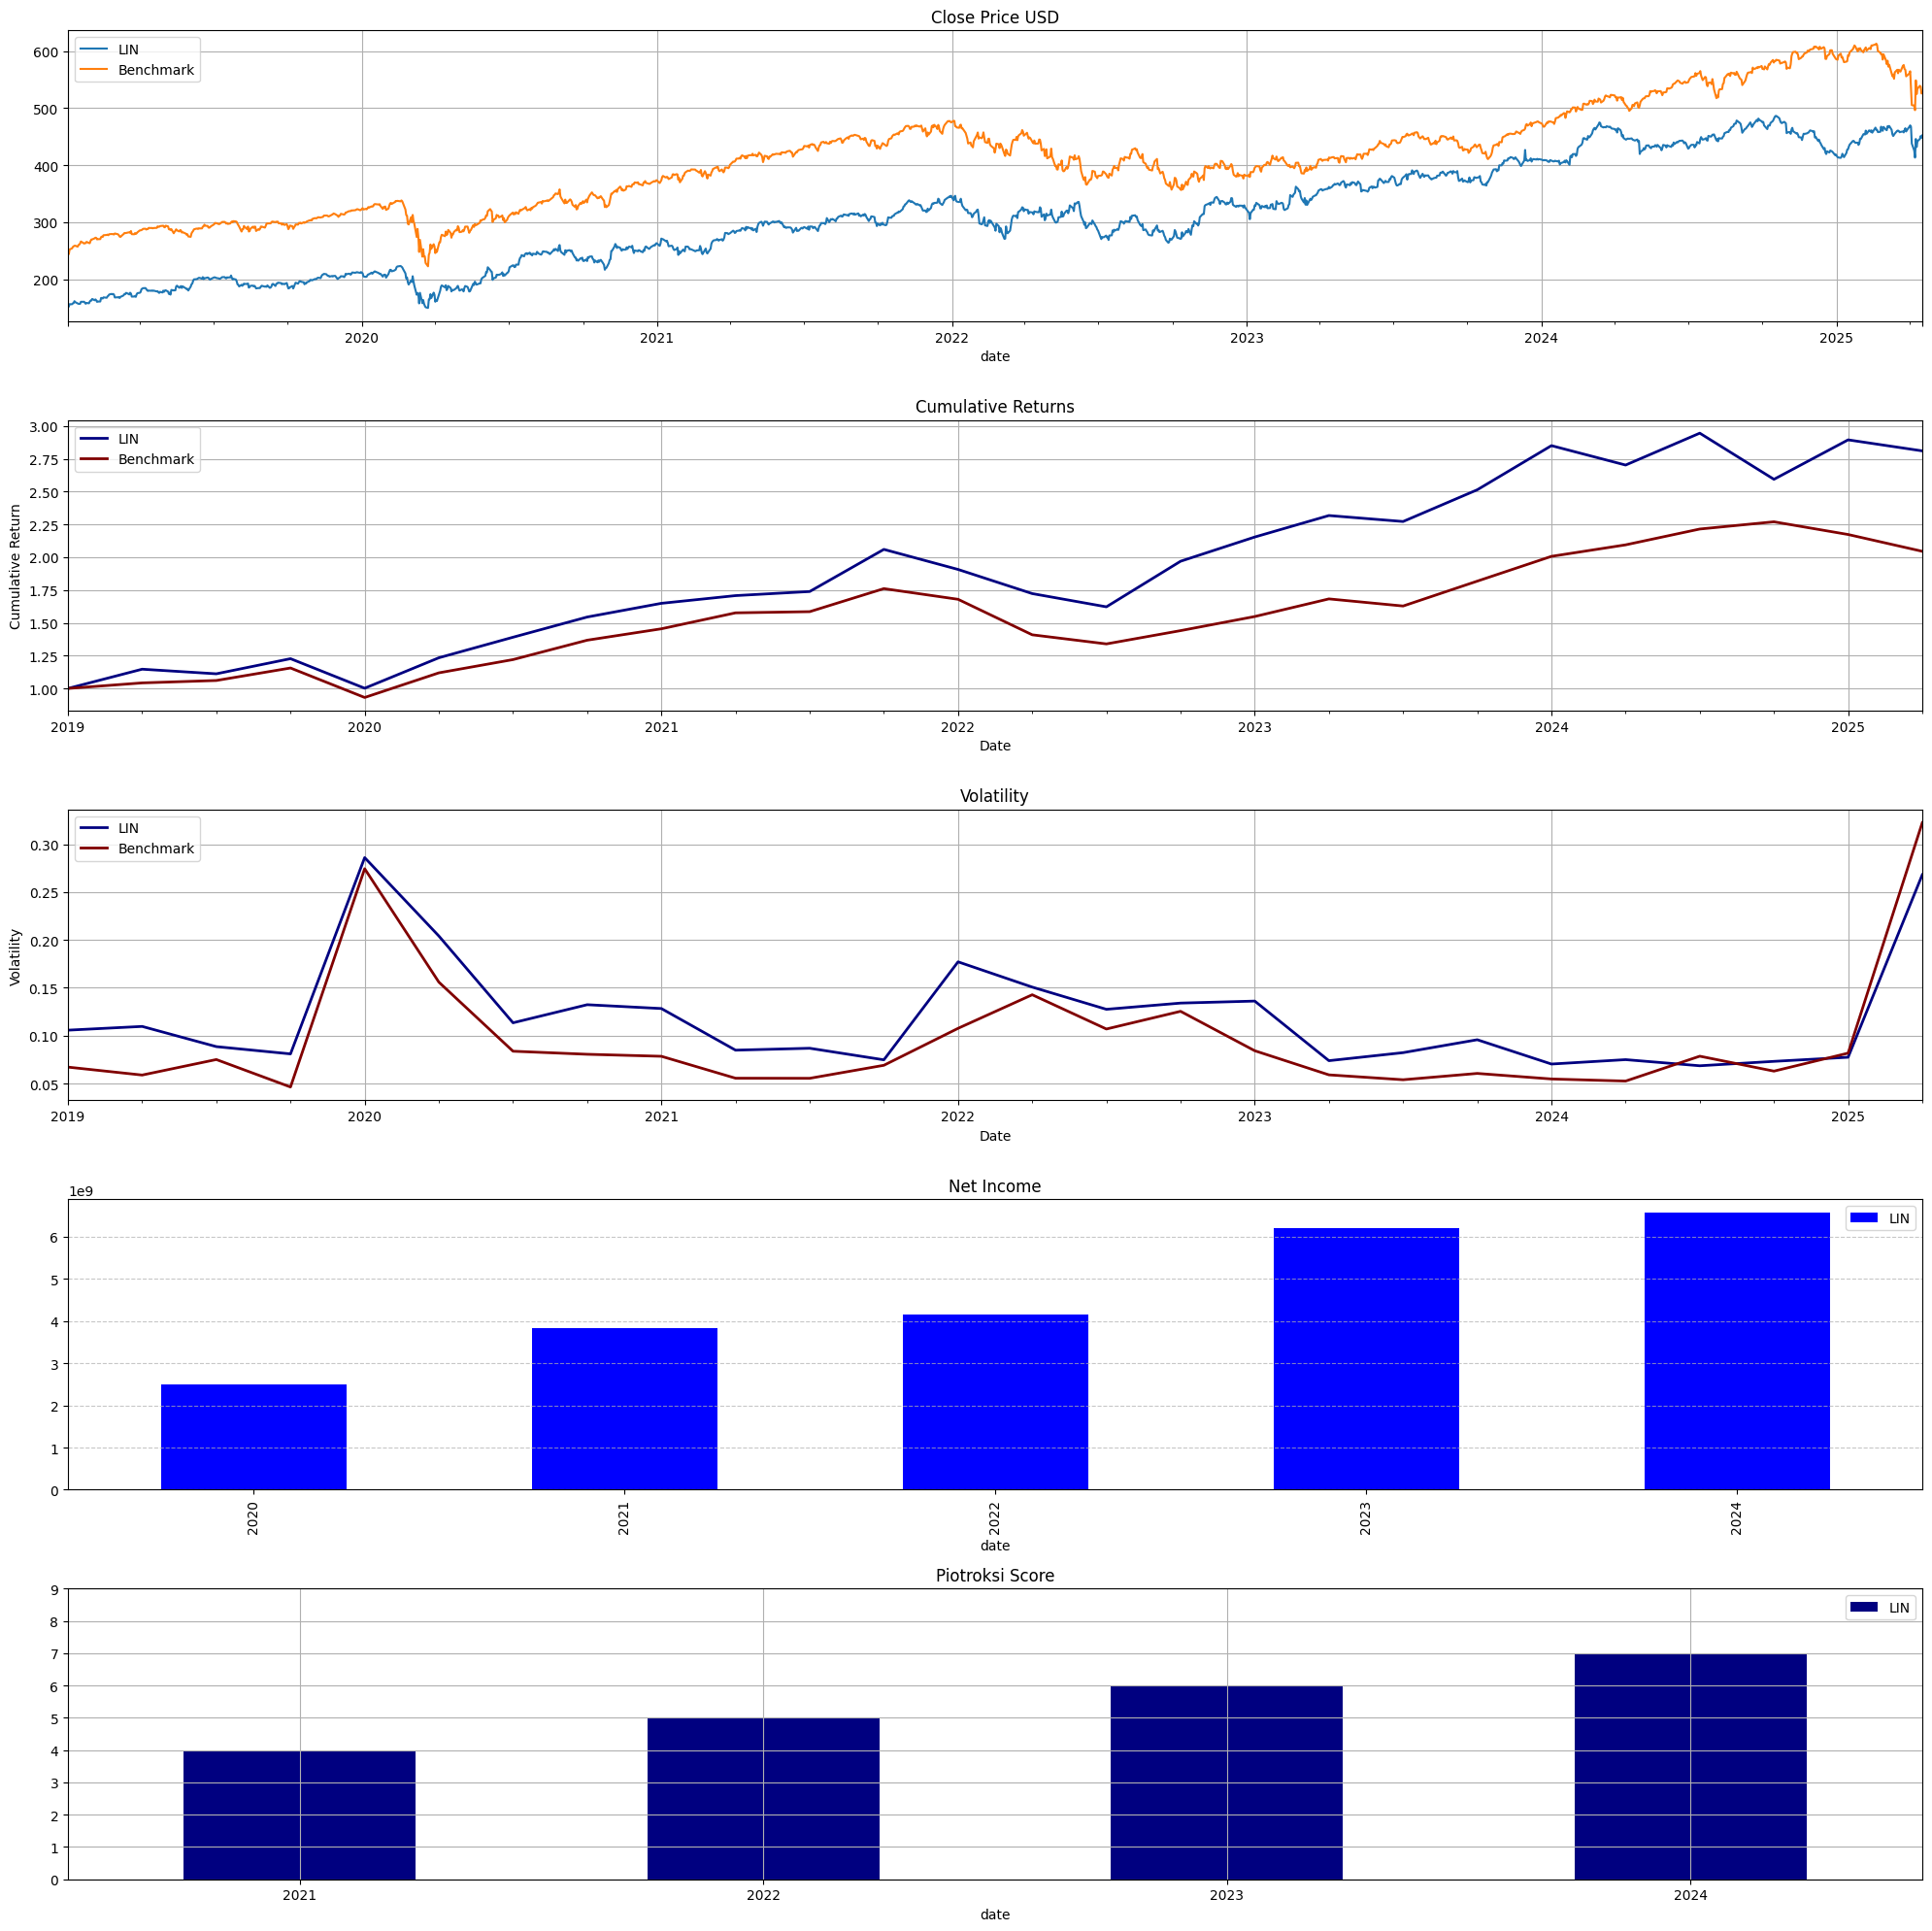
LIN
LINDE PLC (Industrial Inorganic Chemicals)
Fiscal year end : 1231 Report Date : 2024-12-31 Filing Date : 2025-02-26
LINDE PLCConsolidated Balance Sheets 2024 2023 2022 2021
──────────────────────────────────────────────────────────────────────────────────────────────────────────────
Cash & Equivalents millions 4,850 4,664 5,436 2,823 Accounts Receivable millions 4,622 4,718 4,559 4,499 Inventory millions 1,946 2,115 1,978 1,733 Total Current Assets millions 12,945 12,620 13,047 10,159 Goodwill millions 25,937 26,751 25,817 27,038 Other Assets millions 3,030 2,299 2,476 1,984 Total Assets millions 80,147 80,811 79,658 81,605 Accounts Payable millions 2,507 3,020 2,995 3,503 Total Current Liabilities millions 14,544 15,717 16,479 13,643 Long-term Liabilities millions 4,015 3,804 2,795 4,188 Total Liabilities millions 40,659 39,716 38,271 36,164 Commitments & Contingencies Common Stock millions 1 1 1 1 Retained Earnings millions 12,634 8,845 20,541 18,710 Other Comprehensive Income millions( 6,894)( 5,805)( 5,782)( 5,048) Total Stockholders' Equity millions 38,092 39,720 40,028 44,035 Total Liabilities & Equity millions 80,147 80,811 79,658 81,605
LINDE PLCIncome Statements 2024 2023 2022 2021 2020
───────────────────────────────────────────────────────────────────────────────────────────────────────────────────────────
Revenue millions 33,005 32,854 33,364 30,793 27,243Selling, General & Admin millions ( 3,337)( 3,295)( 3,107)( 3,189)( 3,193)Research & Development millions ( 150)( 146)( 143)( 143)( 152)Operating Income millions 8,635 8,024 5,369 4,984 3,322Income Tax millions ( 2,002)( 1,814)( 1,434)( 1,262)( 847)Net Income millions 6,565 6,199 4,147 3,826 2,501 EPS Basic 13.71 12.7 8.3 7.4 4.75 EPS Diluted 13.62 12.59 8.23 7.33 4.71 Shares Basic thousands 478,773 488,191 499,736 516,896 526,736 Shares Diluted thousands 482,092 492,290 504,038 521,875 531,157Available durations for this statement:3 MonthsAnnual
LINDE PLCConsolidated Statement of Cash Flows 2024 2023 2022 2021 2020
──────────────────────────────────────────────────────────────────────────────────────────────────────────────────────────
Inventories millions( 56)( 127)( 347)( 129)( 18) Net Cash from Operations millions 9,423 9,305 8,864 9,725 7,429 Capital Expenditures millions( 4,497)( 3,787)( 3,173)( 3,086)( 3,400) Net Cash from Investing millions( 4,644)( 4,670)( 3,088)( 3,007)( 2,986) Stock Repurchases millions( 4,482)( 3,958)( 5,168)( 4,612)( 2,457) Net Cash from Financing millions( 4,359)( 5,400)( 3,089)( 7,588)( 3,345) Net Change in Cash millions 186( 772) 2,613( 931) 1,054 Total Cash and Equivalents millions 4,850 4,664 5,436 2,823 3,754 Stock-based Compensation millions 107 128 133Available durations for this statement:1 MonthAnnual
Statistics for LIN
Revenue
Net Income
Gross Margin %
Net Margin %
ROE %
ROA %
Loading ITables v2.3.0 from the init_notebook_mode cell...
(need help?)
Performance Details for LIN
22
Loading ITables v2.3.0 from the init_notebook_mode cell...
(need help?)
Maximum Drawdown for LIN
LIN
Benchmark
Loading ITables v2.3.0 from the init_notebook_mode cell...
(need help?)
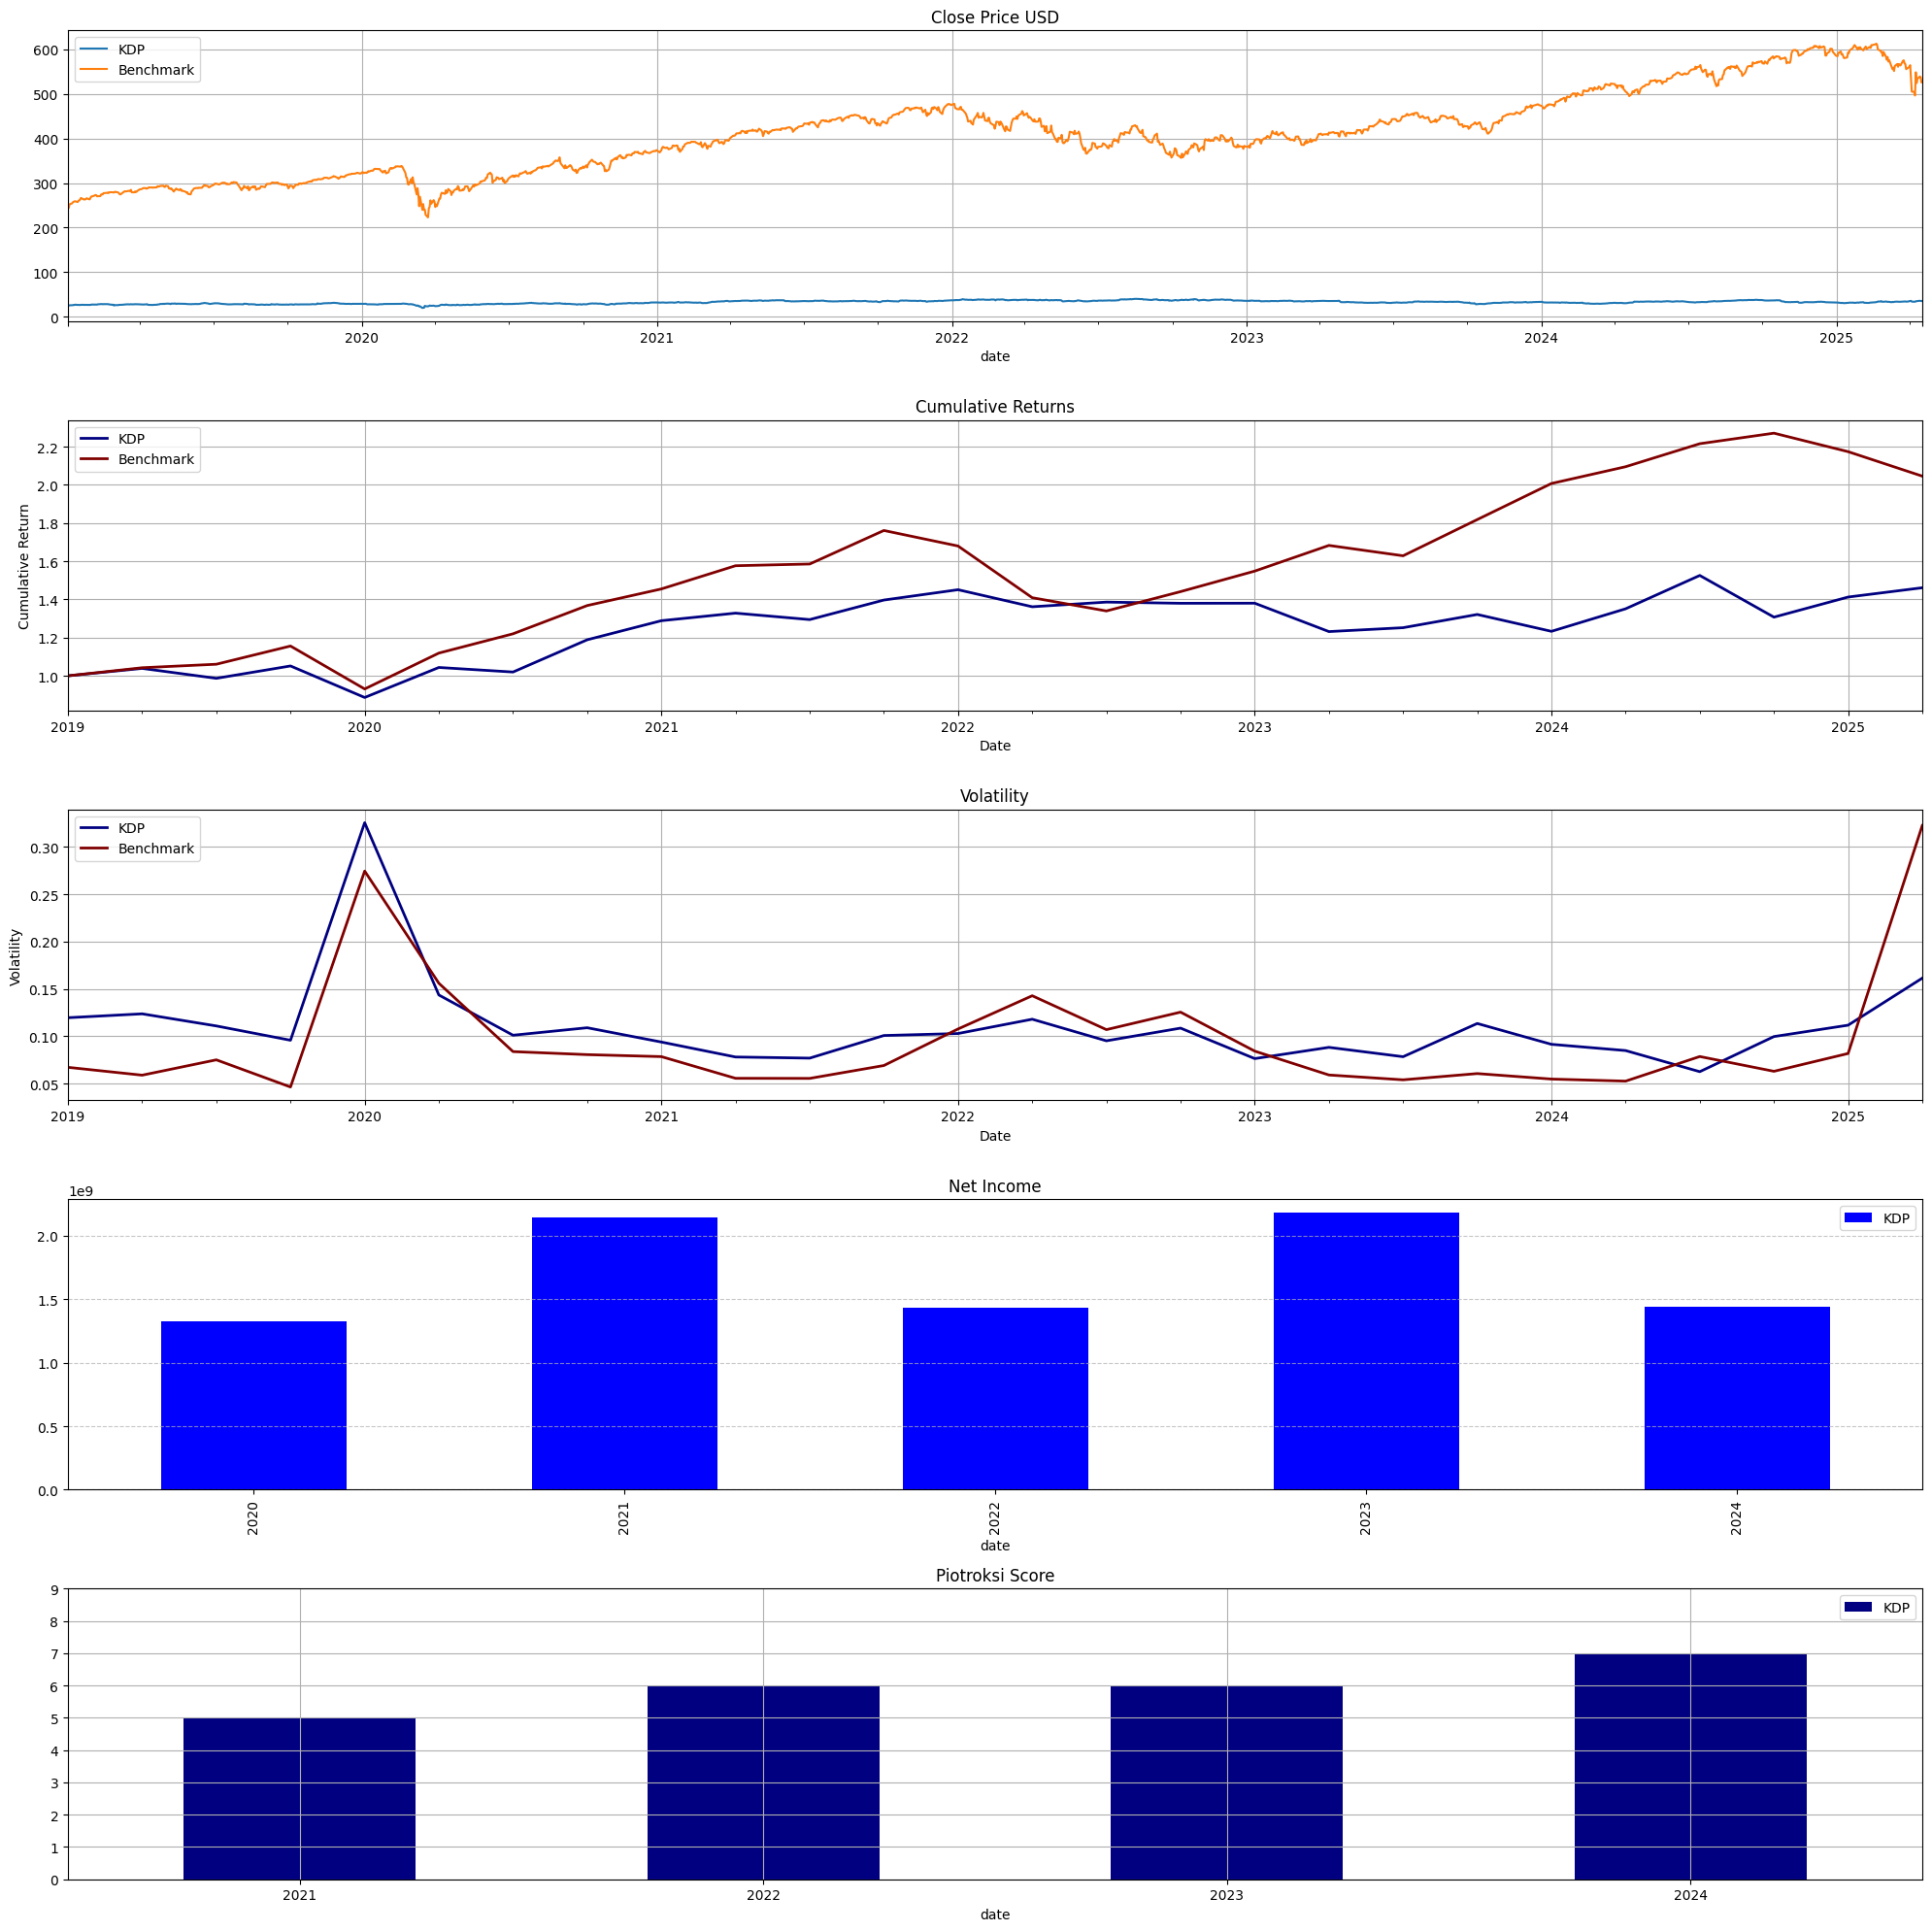
KDP
Keurig Dr Pepper Inc. (Beverages)
Fiscal year end : 1231 Report Date : 2024-12-31 Filing Date : 2025-02-25
Keurig Dr Pepper Inc.Consolidated Balance Sheets 2024 2023 2022 2021 2020
────────────────────────────────────────────────────────────────────────────────────────────────────────────────────
Cash & Equivalents millions 510 267 535 567 Accounts Receivable millions 1,502 1,368 1,484 1,148 Inventory millions 1,299 1,142 1,314 894 Total Current Assets millions 3,997 3,375 3,804 3,057 Property, Plant and Equipment millions 2,964 2,699 2,491 2,494 Goodwill millions 20,053 20,202 20,072 20,182 20,184 Other Assets millions 1,200 1,149 1,252 937 Total Assets millions 53,430 52,130 51,837 50,598 Accounts Payable millions 2,985 3,597 5,206 4,316 Total Current Liabilities millions 8,087 8,916 8,076 6,485 Long-term Liabilities millions 2,753 1,833 1,825 1,577 Total Liabilities millions 29,187 26,454 26,712 25,626 Commitments & Contingencies Common Stock millions 14 14 14 14 Retained Earnings millions 4,793 4,559 3,539 3,199 Other Comprehensive Income millions( 276) 315 129( 26) Total Stockholders' Equity millions 24,243 25,676 25,126 24,972 23,829 Total Liabilities & Equity millions 53,430 52,130 51,837 50,598
Keurig Dr Pepper Inc.Income Statements 2024 2023 2022 2021 2020
──────────────────────────────────────────────────────────────────────────────────────────────────────────────────────────
Revenue millions 15,351 14,814 14,057 12,683 11,618Cost of Sales millions( 6,822)( 6,734)( 6,734)( 5,706)( 5,132)Selling, General & Admin millions( 5,013)( 4,912)( 4,645)( 4,153)( 3,978)Operating Income millions 2,591 3,192 2,605 2,894 2,480Pre-tax Income millions 1,914 2,757 1,719 2,798 1,753Income Tax millions( 473)( 576)( 284)( 653)( 428)Net Income millions 1,441 2,181 1,436 2,146 1,325 EPS Basic 1.06 1.56 1.01 1.52 0.94 EPS Diluted 1.05 1.55 1.01 1.5 0.93 Shares Basic 13,622 13,993 14,168 14,157 14,072 Shares Diluted 13,683 14,084 14,285 14,279 14,221
Keurig Dr Pepper Inc.Consolidated Statement of Cash Flows 2024 2023 2022 2021 2020
────────────────────────────────────────────────────────────────────────────────────────────────────────────────────────
Stock-based Compensation millions 98 116 52 88 85 Inventories millions( 92)( 182)( 426) 133 107 Net Cash from Operations millions 2,219 1,329 2,837 2,874 2,456 Capital Expenditures millions( 563)( 425)( 353)( 423) Net Cash from Investing millions( 1,614)( 784)( 1,135) 210 Stock Repurchases millions( 1,110)( 706)( 379) -0 Net Cash from Financing millions( 223)( 832)( 1,728)( 2,762)Total Cash and Equivalents millions 608 267 535 568
Statistics for KDP
Revenue
Net Income
Gross Margin %
Net Margin %
ROE %
ROA %
Loading ITables v2.3.0 from the init_notebook_mode cell...
(need help?)
Insights for KDP
ROE < 5.0%
Performance Details for KDP
23
Loading ITables v2.3.0 from the init_notebook_mode cell...
(need help?)
Maximum Drawdown for KDP
KDP
Benchmark
Loading ITables v2.3.0 from the init_notebook_mode cell...
(need help?)
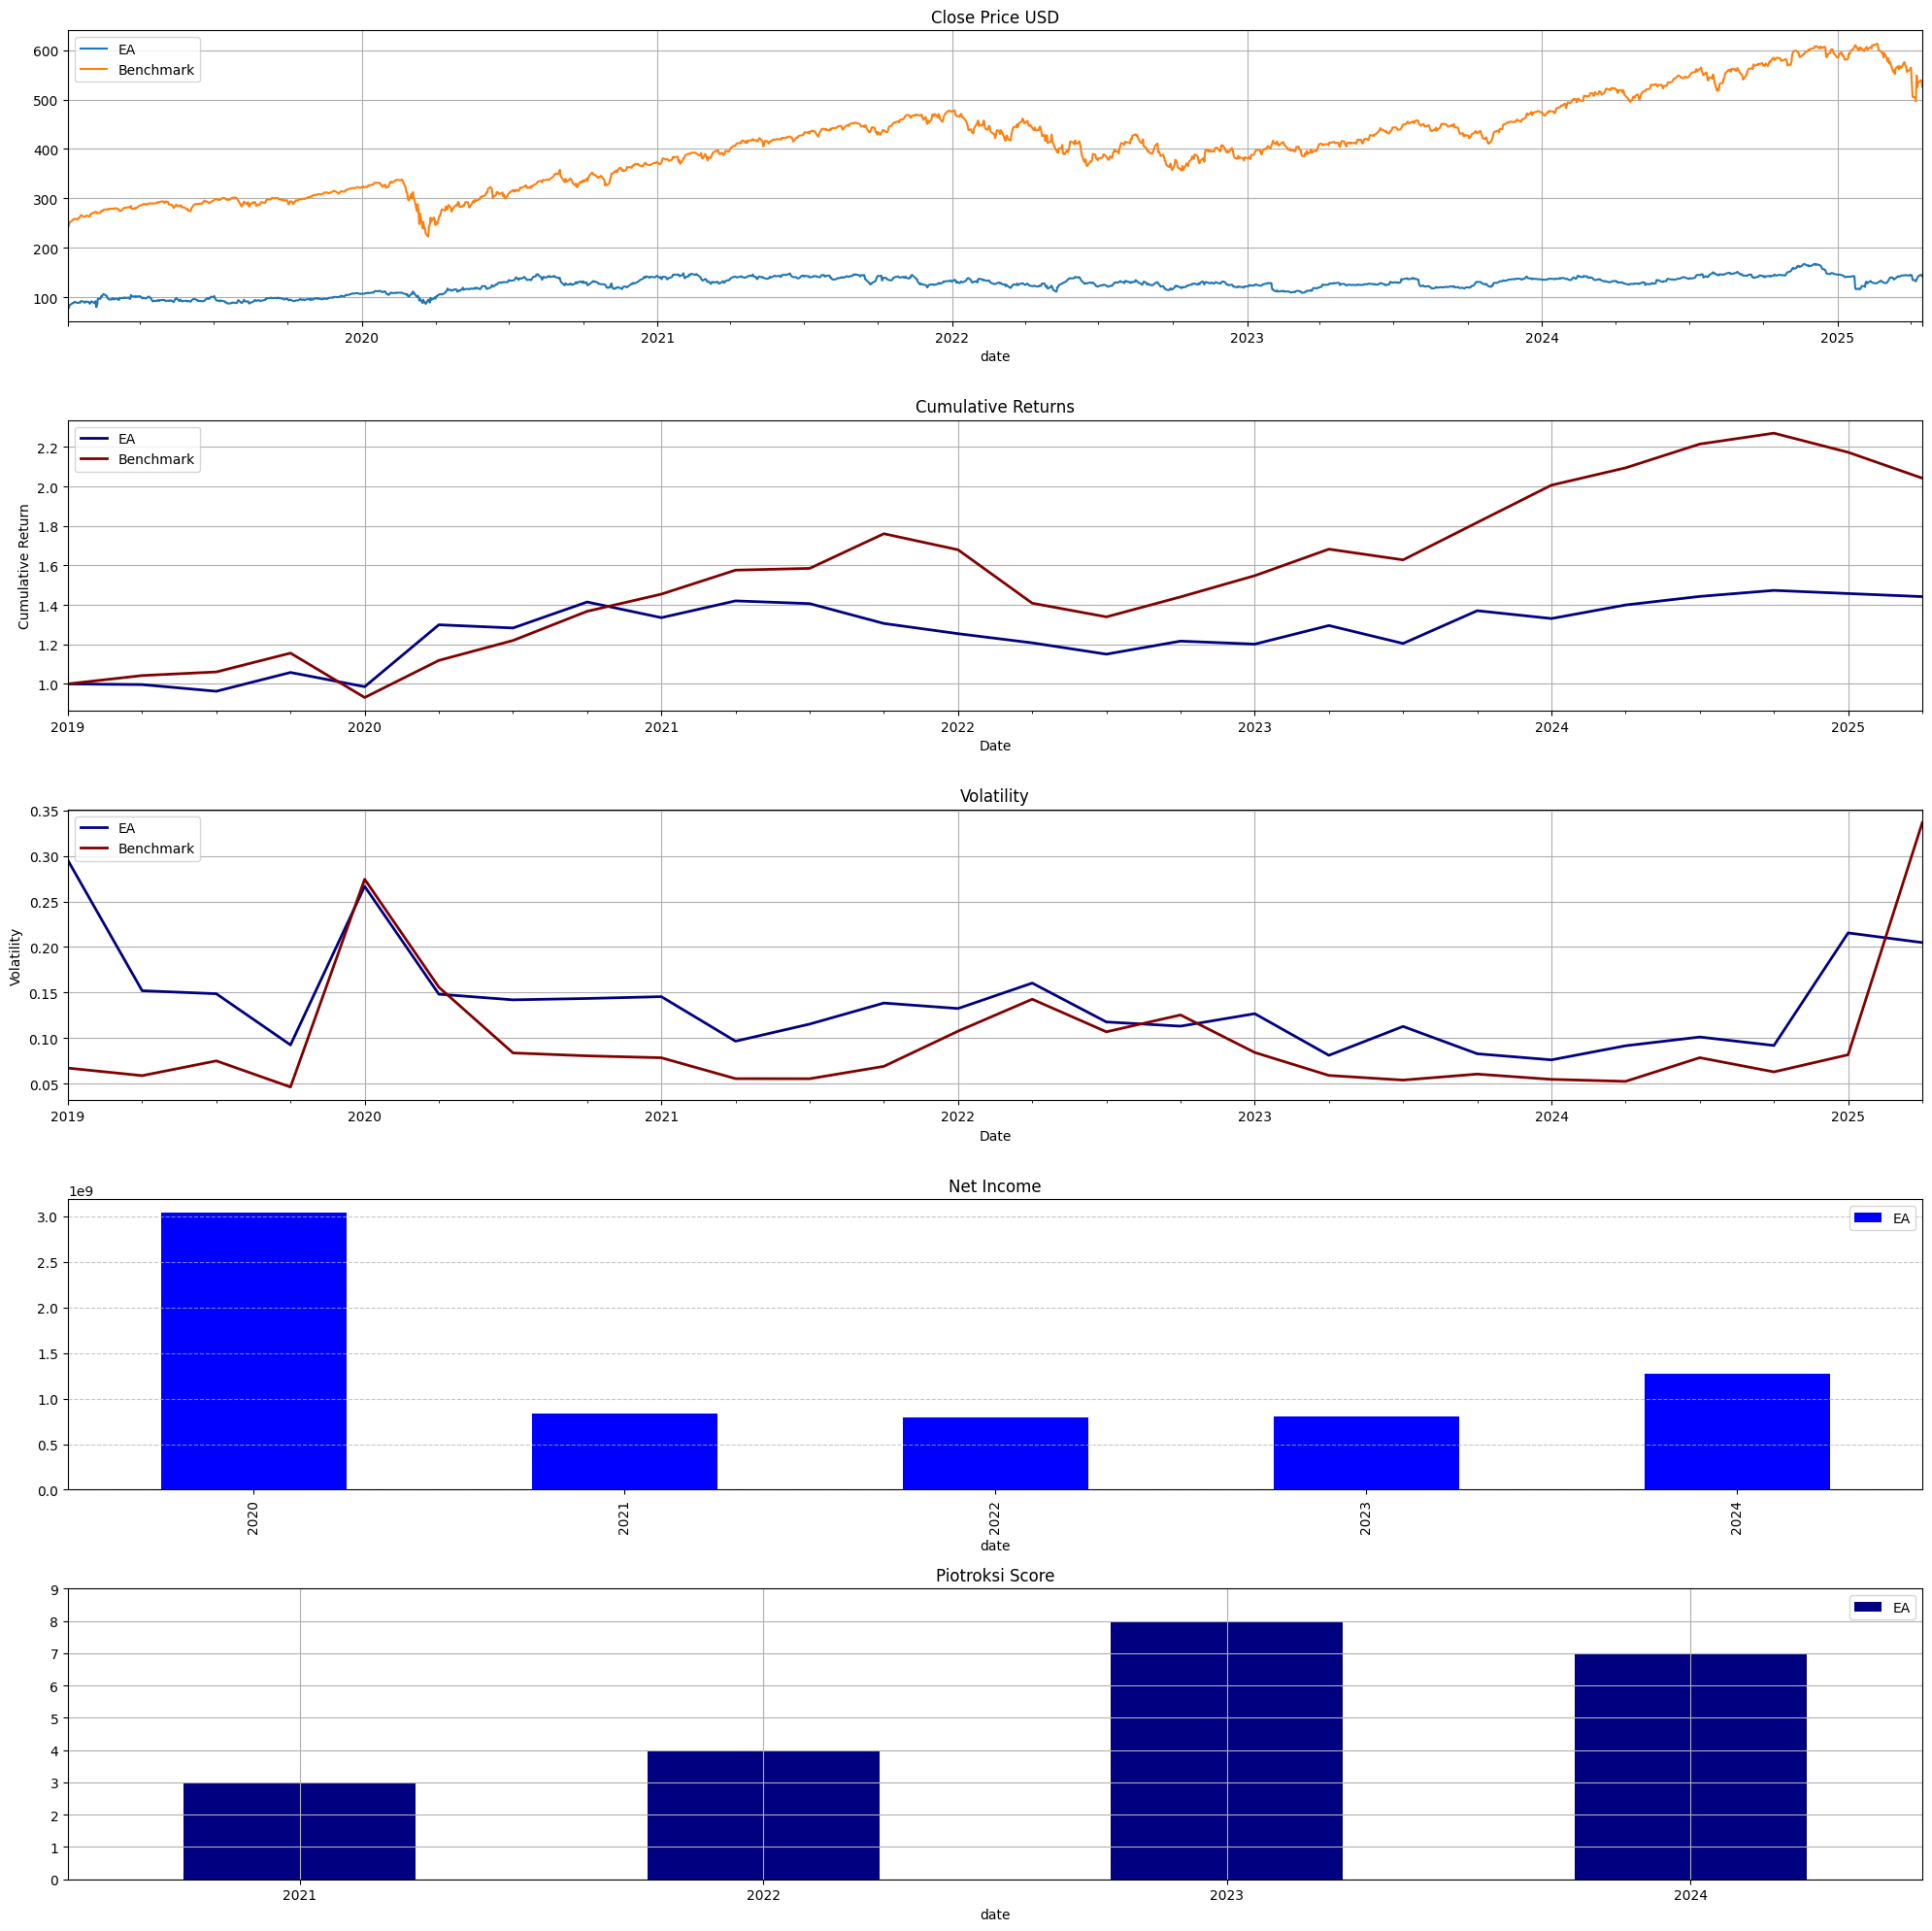
EA
ELECTRONIC ARTS INC. (Services-Prepackaged Software)
Fiscal year end : 0331 Report Date : 2024-03-31 Filing Date : 2024-05-22
ELECTRONIC ARTS INC.Consolidated Balance Sheets 2024 2023 2022 2021 2020
────────────────────────────────────────────────────────────────────────────────────────────────────────────────────────
Accounts Receivable millions 565 684 650 521 Total Current Assets millions 4,247 3,969 4,151 7,213 Property, Plant and Equipment millions 578 549 550 491 Goodwill millions 5,379 5,380 5,387 2,868 1,885 Other Assets millions 436 481 507 362 Total Assets millions 13,420 13,459 13,800 13,288 Accounts Payable millions 110 99 101 96 Total Current Liabilities millions 3,090 3,285 3,513 2,964 Long-term Liabilities millions 437 393 397 250 Total Liabilities millions 5,907 6,166 6,175 5,448 Commitments & Contingencies Common Stock millions 3 3 3 3 Retained Earnings millions 7,582 7,357 7,607 7,887 Other Comprehensive Income millions( 72)( 67) 15( 50)( 50) Total Stockholders' Equity millions 7,513 7,293 7,625 7,840 7,461 Total Liabilities & Equity millions 13,420 13,459 13,800 13,288 Cash & Equivalents millions 2,732 5,260 3,768
ELECTRONIC ARTS INC.Income Statements 2024 2023 2022 2021 2020
──────────────────────────────────────────────────────────────────────────────────────────────────────────────────────────
Total Operating Expenses millions( 4,334)( 4,302)( 4,003)( 3,089)( 2,723)Operating Income millions 1,518 1,332 1,129 1,046 1,445Pre-tax Income millions 1,589 1,326 1,081 1,017 1,508Income Tax millions( 316)( 524)( 292)( 180)( 1,531)Net Income millions 1,273 802 789 837 3,039 EPS Basic 4.71 2.9 2.78 2.9 10.37 EPS Diluted 4.68 2.88 2.76 2.87 10.3 Shares Basic millions 270 277 284 289 293 Shares Diluted millions 272 278 286 292 295
ELECTRONIC ARTS INC.Consolidated Statement of Cash Flows 2024 2023 2022 2021 2020
──────────────────────────────────────────────────────────────────────────────────────────────────────────────────────────
Stock-based Compensation millions 584 548 528 435 347 Net Cash from Operations millions 2,315 1,550 1,899 1,934 1,797 Net Cash from Investing millions( 207)( 217)( 2,804)( 505)( 1,357) Stock Repurchases millions( 1,300)( 1,295)( 1,300)( 729)( 1,207) Net Cash from Financing millions( 1,624)( 1,600)( 1,620)( 15)( 1,358)Net Change in Cash millions 476( 308)( 2,528) 1,492( 940)Total Cash and Equivalents millions 2,900 2,424 2,732 5,260
Statistics for EA
Revenue
Net Income
Gross Margin %
Net Margin %
ROE %
ROA %
Loading ITables v2.3.0 from the init_notebook_mode cell...
(need help?)
Performance Details for EA
24
Loading ITables v2.3.0 from the init_notebook_mode cell...
(need help?)
Maximum Drawdown for EA
EA
Benchmark
Loading ITables v2.3.0 from the init_notebook_mode cell...
(need help?)
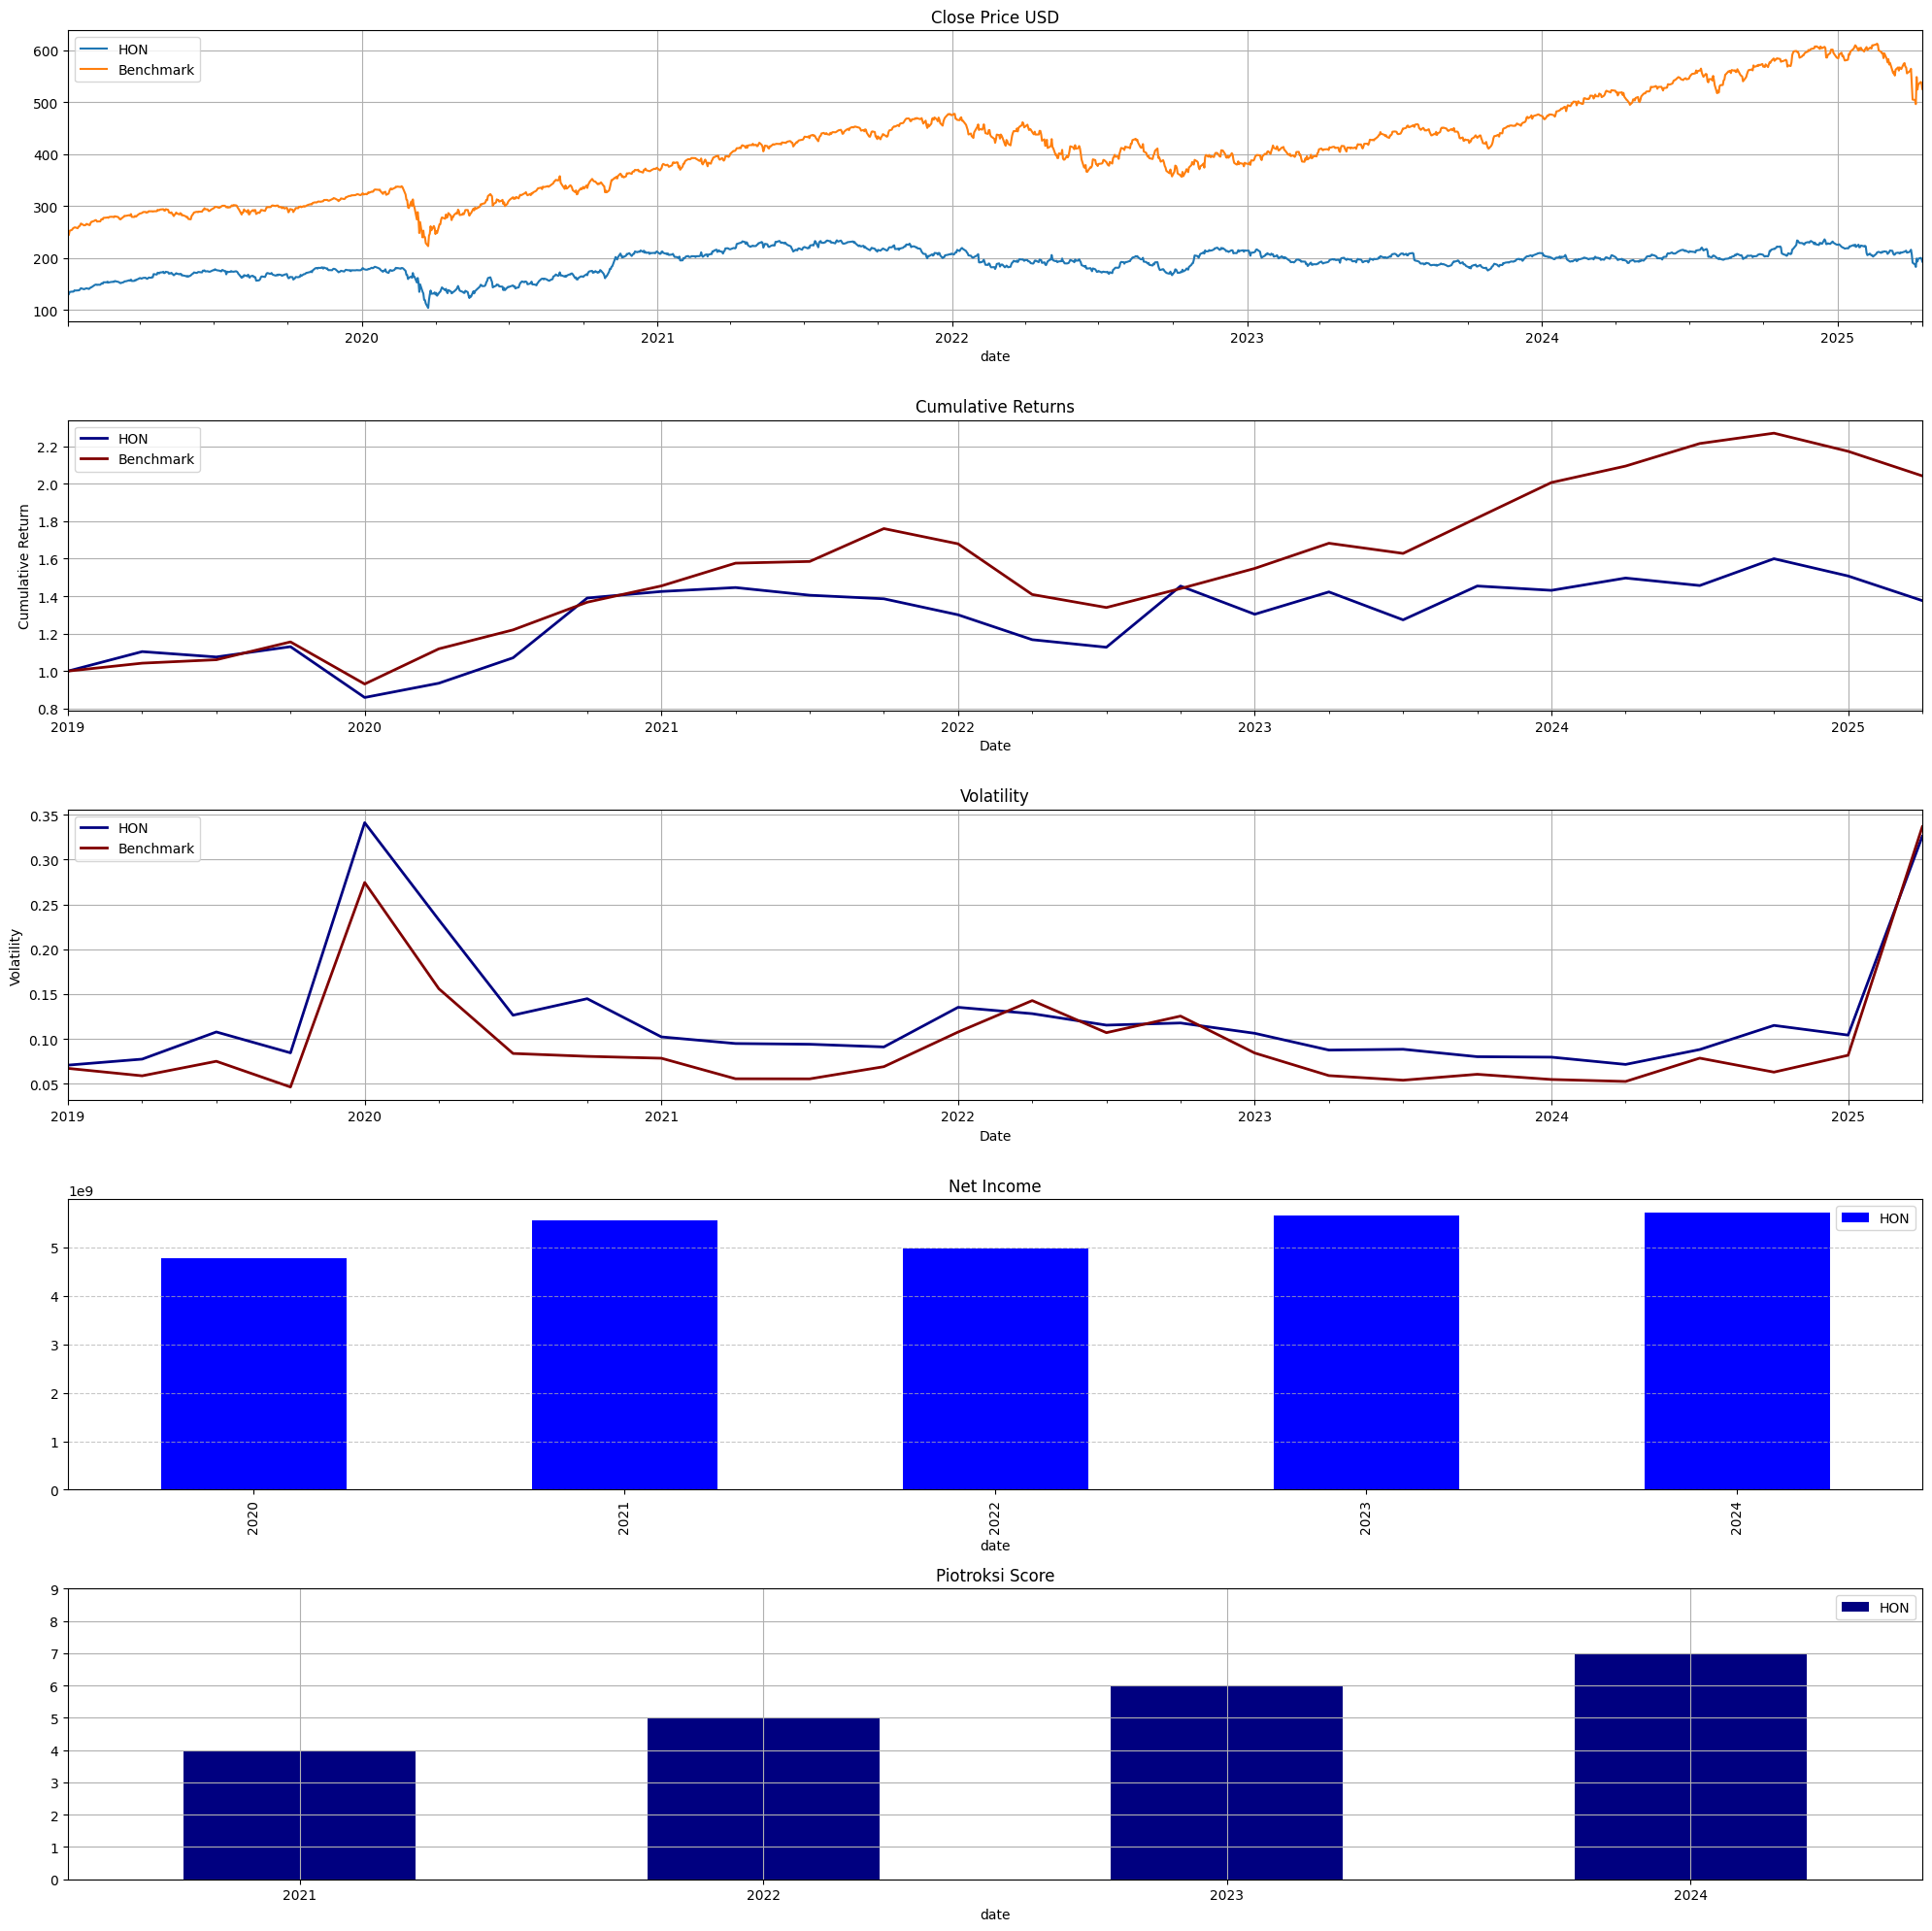
HON
HONEYWELL INTERNATIONAL INC (Aircraft Engines & Engine Parts)
Fiscal year end : 1231 Report Date : 2024-12-31 Filing Date : 2025-02-14
Honeywell International Inc.Consolidated Balance Sheets 2024 2023 2022 2021
──────────────────────────────────────────────────────────────────────────────────────────────────────────────
Cash & Equivalents millions 10,567 7,925 9,627 10,959 Accounts Receivable millions 7,819 7,530 7,440 6,830 Inventory millions 6,442 6,178 5,538 5,138 Total Current Assets millions 27,908 23,502 24,982 25,372 Goodwill millions 21,825 18,049 17,497 17,756 Other Assets millions 10,810 9,582 9,513 10,134 Total Assets millions 75,196 61,525 62,275 64,470 Accounts Payable millions 6,880 6,849 6,329 6,484 Total Current Liabilities millions 21,256 18,539 19,938 19,508 Long-term Liabilities millions 6,076 6,265 6,469 7,087 Other Comprehensive Income millions( 3,491)( 4,135)( 3,475)( 2,895) Retained Earnings millions 50,835 47,979 45,093 42,827 Total Stockholders' Equity millions 18,619 15,856 16,697 18,569Total Liabilities & Equity millions 75,196 61,525 62,275 64,470 Property, Plant and Equipment millions 5,471 5,562
Honeywell International Inc.Income Statements 2024 2023 2022 2021 2020
──────────────────────────────────────────────────────────────────────────────────────────────────────────────────────────
Revenue millions 12,219 10,889 9,506 25,643 32,637 Cost of Sales millions( 6,609)( 6,018)( 5,392) 17,082( 22,169) Research & Development millions 1,536 1,456 1,478 1,333 Selling, General & Admin millions( 5,466)( 5,127)( 5,214) 4,798( 4,772)Pre-tax Income millions 7,213 7,159 6,379 7,235 6,012Income Tax millions( 1,473)( 1,487)( 1,412)( 1,625)( 1,147)Net Income millions 5,705 5,658 4,966 5,542 4,779EPS Basic 8.76 8.53 7.33 8.01 6.79EPS Diluted 8.71 8.47 7.27 7.91 6.72
Honeywell International Inc.Consolidated Statement of Cash Flows 2024 2023 2022 2021 2020
──────────────────────────────────────────────────────────────────────────────────────────────────────────────────────────
Stock-based Compensation millions 194 202 188 217 168 Inventories millions( 304)( 626)( 440)( 685)( 67) Net Cash from Operations millions 6,097 5,340 5,274 6,038 6,208 Capital Expenditures millions( 1,164)( 1,039)( 766)( 895)( 906) Net Cash from Investing millions( 10,157)( 1,293)( 93)( 1,061)( 987) Stock Repurchases millions( 1,655)( 3,715)( 4,200)( 3,380)( 3,714) Net Cash from Financing millions 6,839( 5,763)( 6,330)( 8,254)( 81)Net Change in Cash millions 2,642( 1,702)( 1,332)( 3,316) 5,208Total Cash and Equivalents millions 10,567 7,925 9,627 10,959 14,275Available durations for this statement:6 MonthsAnnual
Statistics for HON
Revenue
Net Income
Gross Margin %
Net Margin %
ROE %
ROA %
Loading ITables v2.3.0 from the init_notebook_mode cell...
(need help?)
Performance Details for HON
25
Loading ITables v2.3.0 from the init_notebook_mode cell...
(need help?)
Maximum Drawdown for HON
HON
Benchmark
Loading ITables v2.3.0 from the init_notebook_mode cell...
(need help?)
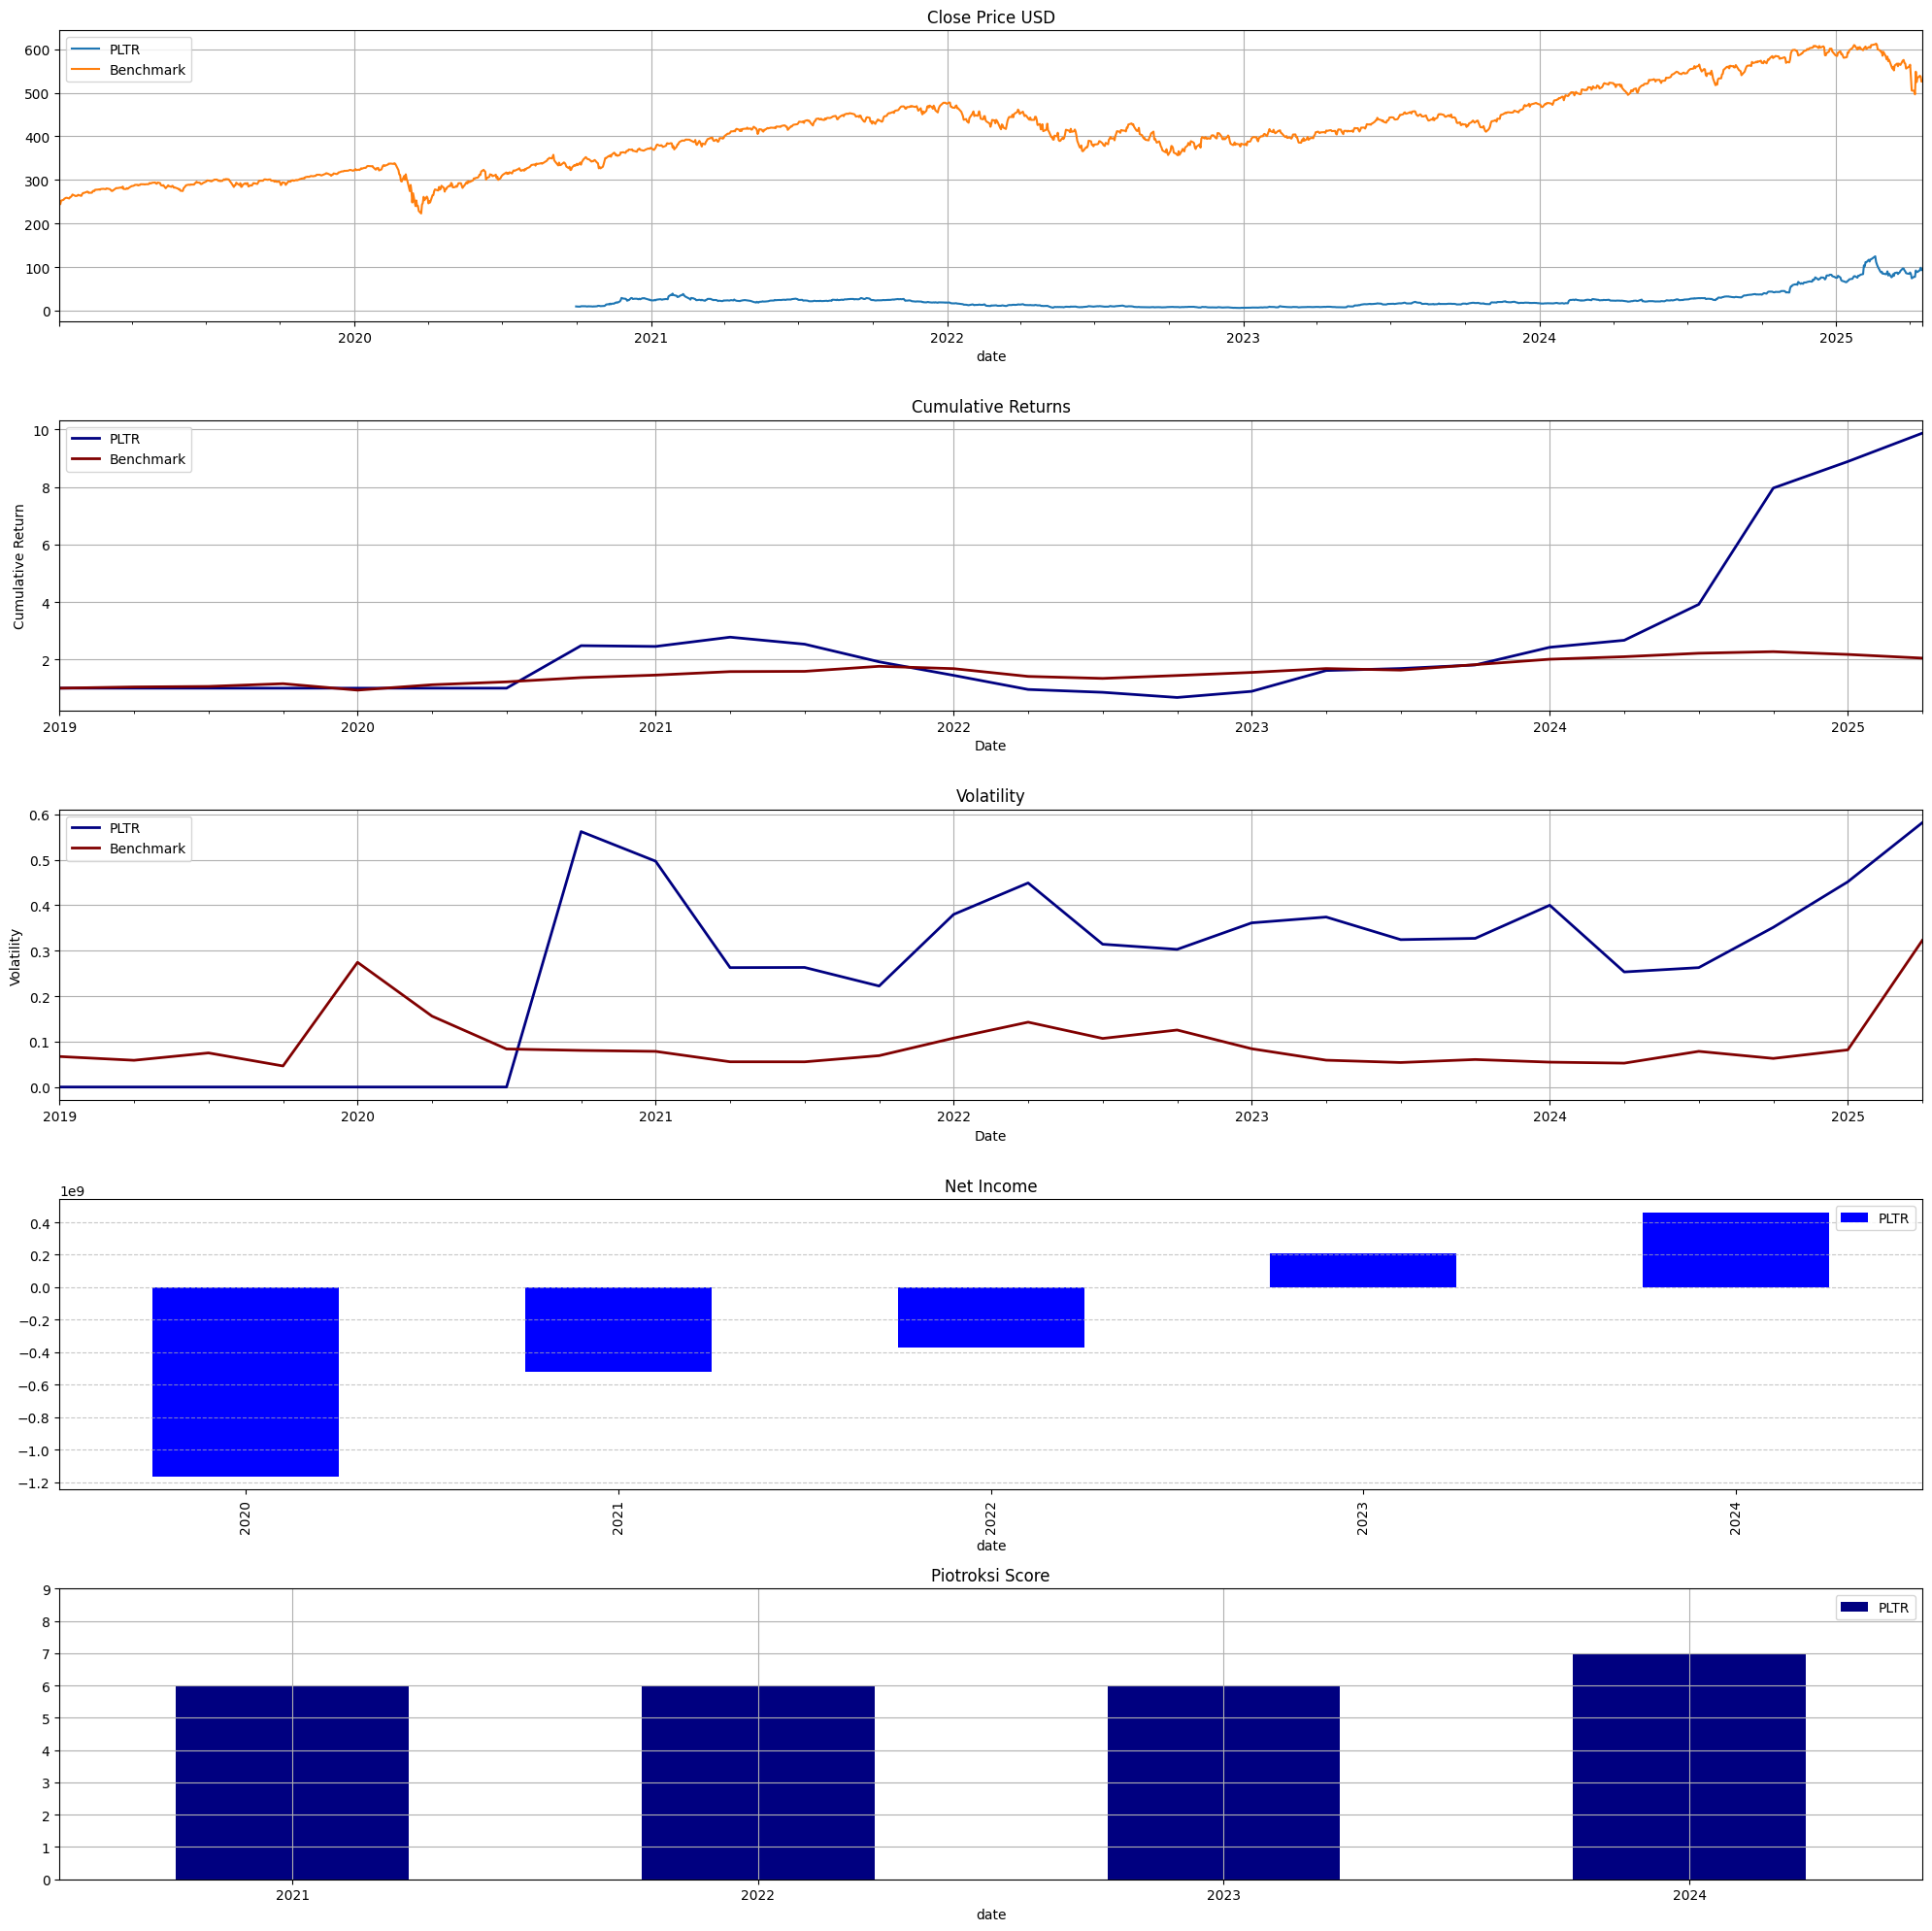
PLTR
Palantir Technologies Inc. (Services-Prepackaged Software)
Fiscal year end : 1231 Report Date : 2024-12-31 Filing Date : 2025-02-18
Palantir Technologies Inc.Consolidated Balance Sheets 2024 2023 2022 2021
───────────────────────────────────────────────────────────────────────────────────────────────────────────────────
Cash & Equivalents thousands 2,098,524 831,047 2,598,540 2,290,674 Accounts Receivable 5,750 3,648 2,583 1,909 Total Current Assets thousands 5,934,289 4,138,618 3,041,577 2,863,250 Property, Plant and Equipment thousands 39,638 47,758 69,170 31,304 Other Assets thousands 166,217 153,186 150,252 96,386 Total Assets thousands 6,340,884 4,522,425 3,461,239 3,247,450 Accounts Payable thousands 103 12,122 44,788 74,907 Total Current Liabilities thousands 996,018 746,018 587,941 660,061 Long-term Liabilities thousands 13,685 10,702 12,655 2,297 Total Liabilities thousands 1,246,477 961,460 818,802 956,420 Commitments & Contingencies Common Stock thousands 2,339 2,200 2,099 2,027 Other Comprehensive Income thousands ( 5,611) 801 ( 5,333) ( 2,349) Retained Earnings thousands(5,187,423)(5,649,613)(5,859,438)(5,485,733) Total Stockholders' Equity thousands 5,003,275 3,475,561 2,565,326 2,291,030 Total Liabilities & Equity thousands 6,340,884 4,522,425 3,461,239 3,247,450
Palantir Technologies Inc.Consolidated Statement of Cash Flows 2024 2023 2022 2021 2020
────────────────────────────────────────────────────────────────────────────────────────────────────────────────────────────
Stock-based Compensation thousands 691,638 475,903 564,798 778,215 1,270,702 Net Cash from Operations thousands 1,153,865 712,183 223,737 333,851( 296,608) Capital Expenditures thousands( 12,634) ( 15,114)( 40,027)( 12,627)( 12,236) Net Cash from Investing thousands( 340,655)(2,711,180)( 45,427)( 397,912)( 14,920) Stock Repurchases thousands( 64,196) -0 -0 Net Cash from Financing thousands 463,364 218,839 85,996 306,747 1,036,453Net Change in Cash thousands 1,269,829(1,777,228) 260,421 238,768 726,184Total Cash and Equivalents thousands 2,119,936 850,107 2,627,335 2,366,914 2,128,146
Statistics for PLTR
Revenue
Net Income
Gross Margin %
Net Margin %
ROE %
ROA %
Loading ITables v2.3.0 from the init_notebook_mode cell...
(need help?)
Performance Details for PLTR
26
Loading ITables v2.3.0 from the init_notebook_mode cell...
(need help?)
Maximum Drawdown for PLTR
PLTR
Benchmark
Loading ITables v2.3.0 from the init_notebook_mode cell...
(need help?)
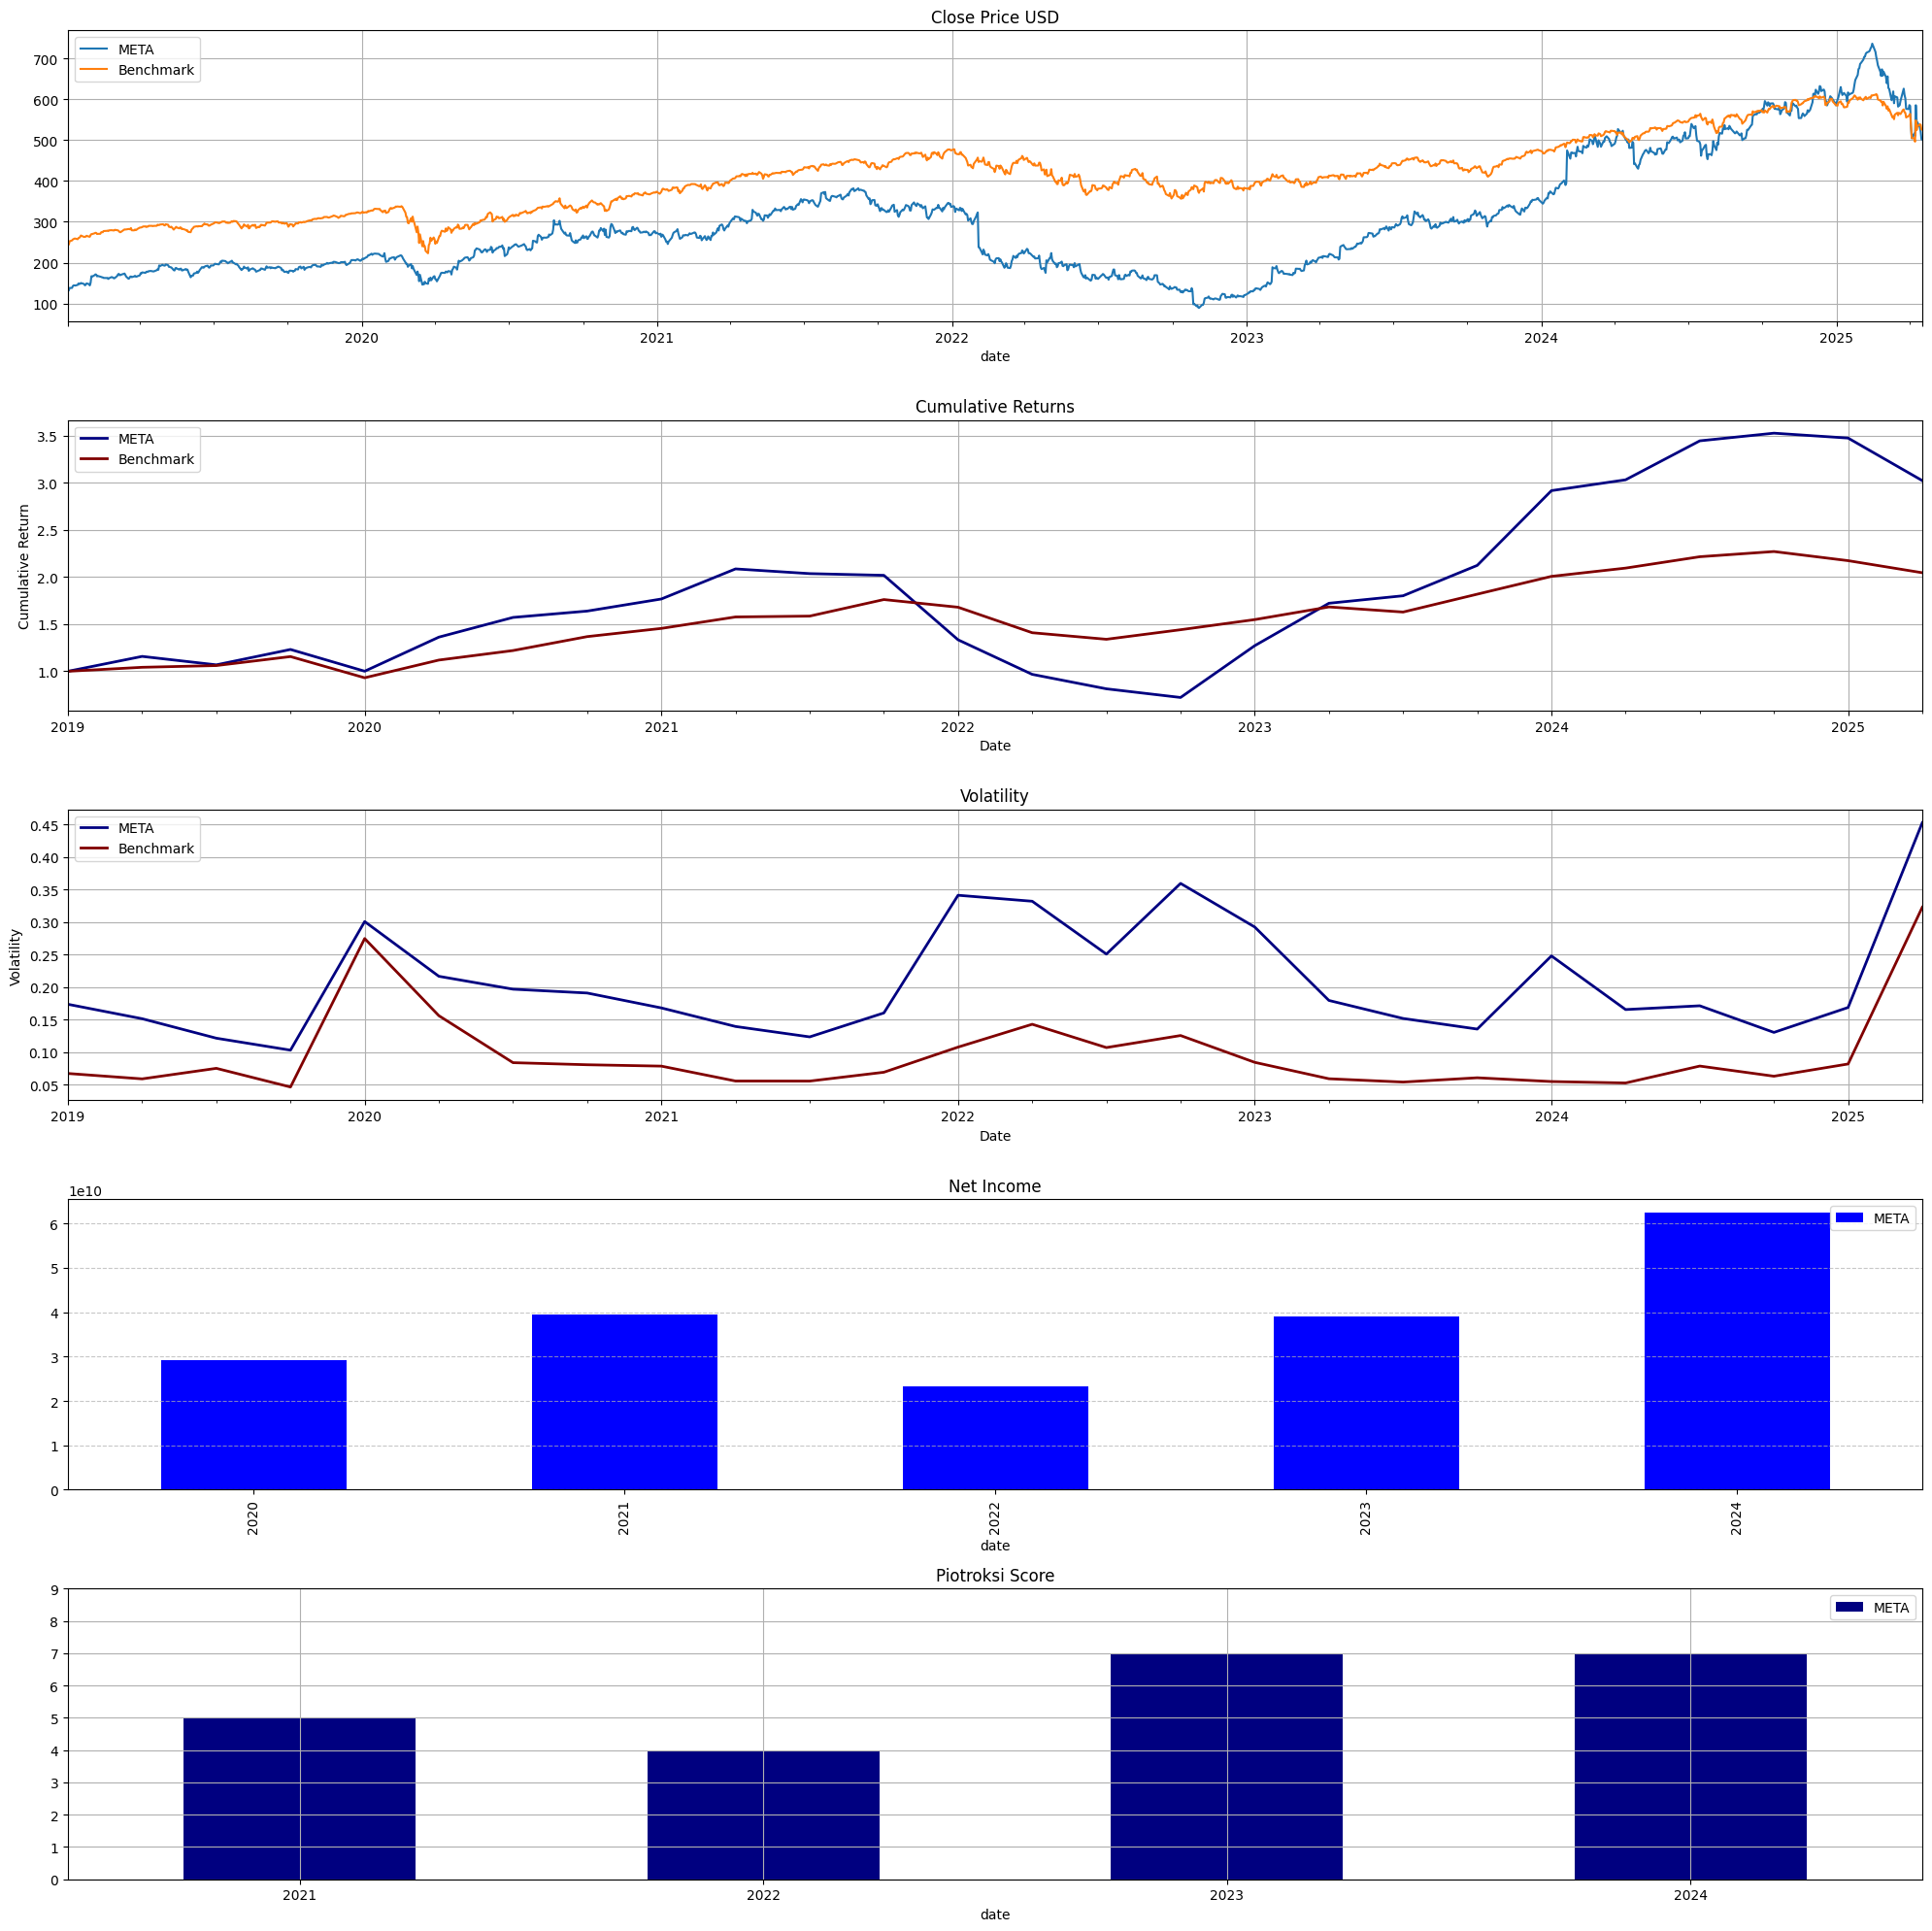
META
Meta Platforms, Inc. (Services-Computer Programming, Data Processing, Etc.)
Fiscal year end : 1231 Report Date : 2024-12-31 Filing Date : 2025-01-30
Meta Platforms, Inc.Consolidated Balance Sheets 2024 2023 2022 2021 2020
────────────────────────────────────────────────────────────────────────────────────────────────────────────────────────
Cash & Equivalents millions 43,889 41,862 14,681 16,601 17,576 Accounts Receivable millions 16,994 16,169 13,466 14,039 Total Current Assets millions 100,045 85,365 59,549 66,666 Goodwill millions 20,654 20,654 20,306 19,197 19,050 Other Assets millions 13,017 7,582 6,583 2,751 Total Assets millions 276,054 229,623 185,727 165,987 Total Current Liabilities millions 33,596 31,960 27,026 21,135 Long-term Liabilities millions 2,716 1,370 7,764 7,227 Total Liabilities millions 93,417 76,455 60,014 41,108 Commitments & Contingencies Common Stock millions 0 0 0 0 Other Comprehensive Income millions( 3,097)( 2,155)( 3,530)( 693) Retained Earnings millions 102,506 82,070 64,799 69,761 Total Stockholders' Equity millions 182,637 153,168 125,713 124,879 128,290 Total Liabilities & Equity millions 276,054 229,623 185,727 165,987
Meta Platforms, Inc.Income Statements 2024 2023 2022 2021 2020
──────────────────────────────────────────────────────────────────────────────────────────────────────────────────────────
Revenue millions 164,501 134,902 116,609 117,929 85,965 Research & Development millions 43,873 38,483 35,338 24,655 18,447Operating Income millions 69,380 46,751 28,944 46,753 32,671Pre-tax Income millions 70,663 47,428 28,819 47,284 33,180Income Tax millions( 8,303)( 8,330)( 5,619)( 7,914)( 4,034)Net Income millions 62,360 39,098 23,200 39,370 29,146 EPS Basic 24.61 15.19 8.63 13.99 10.22 EPS Diluted 23.86 14.87 8.59 13.77 10.09 Shares Basic millions 2,534 2,574 2,687 2,815 2,851 Shares Diluted millions 2,614 2,629 2,702 2,859 2,888
Meta Platforms, Inc.Consolidated Statement of Cash Flows 2024 2023 2022 2021 2020
──────────────────────────────────────────────────────────────────────────────────────────────────────────────────────────
Stock-based Compensation millions 16,690 14,027 11,992 9,164 6,536 Net Cash from Operations millions 91,328 71,113 50,475 57,683 38,747 Capital Expenditures millions( 37,256)( 27,045)( 31,186)( 18,690)( 15,163) Net Cash from Investing millions( 47,150)( 24,495)( 28,970)( 7,570)( 30,059) Stock Repurchases millions( 30,125)( 19,774)( 27,956)( 44,537)( 6,272) Net Cash from Financing millions( 40,781)( 19,500)( 22,136)( 50,728)( 10,292)Net Change in Cash millions 2,611 27,231( 1,269)( 1,089)( 1,325)Total Cash and Equivalents millions 45,438 42,827 15,596 16,865 17,954
Statistics for META
Revenue
Net Income
Gross Margin %
Net Margin %
ROE %
ROA %
Loading ITables v2.3.0 from the init_notebook_mode cell...
(need help?)
Performance Details for META
27
Loading ITables v2.3.0 from the init_notebook_mode cell...
(need help?)
Maximum Drawdown for META
META
Benchmark
Loading ITables v2.3.0 from the init_notebook_mode cell...
(need help?)
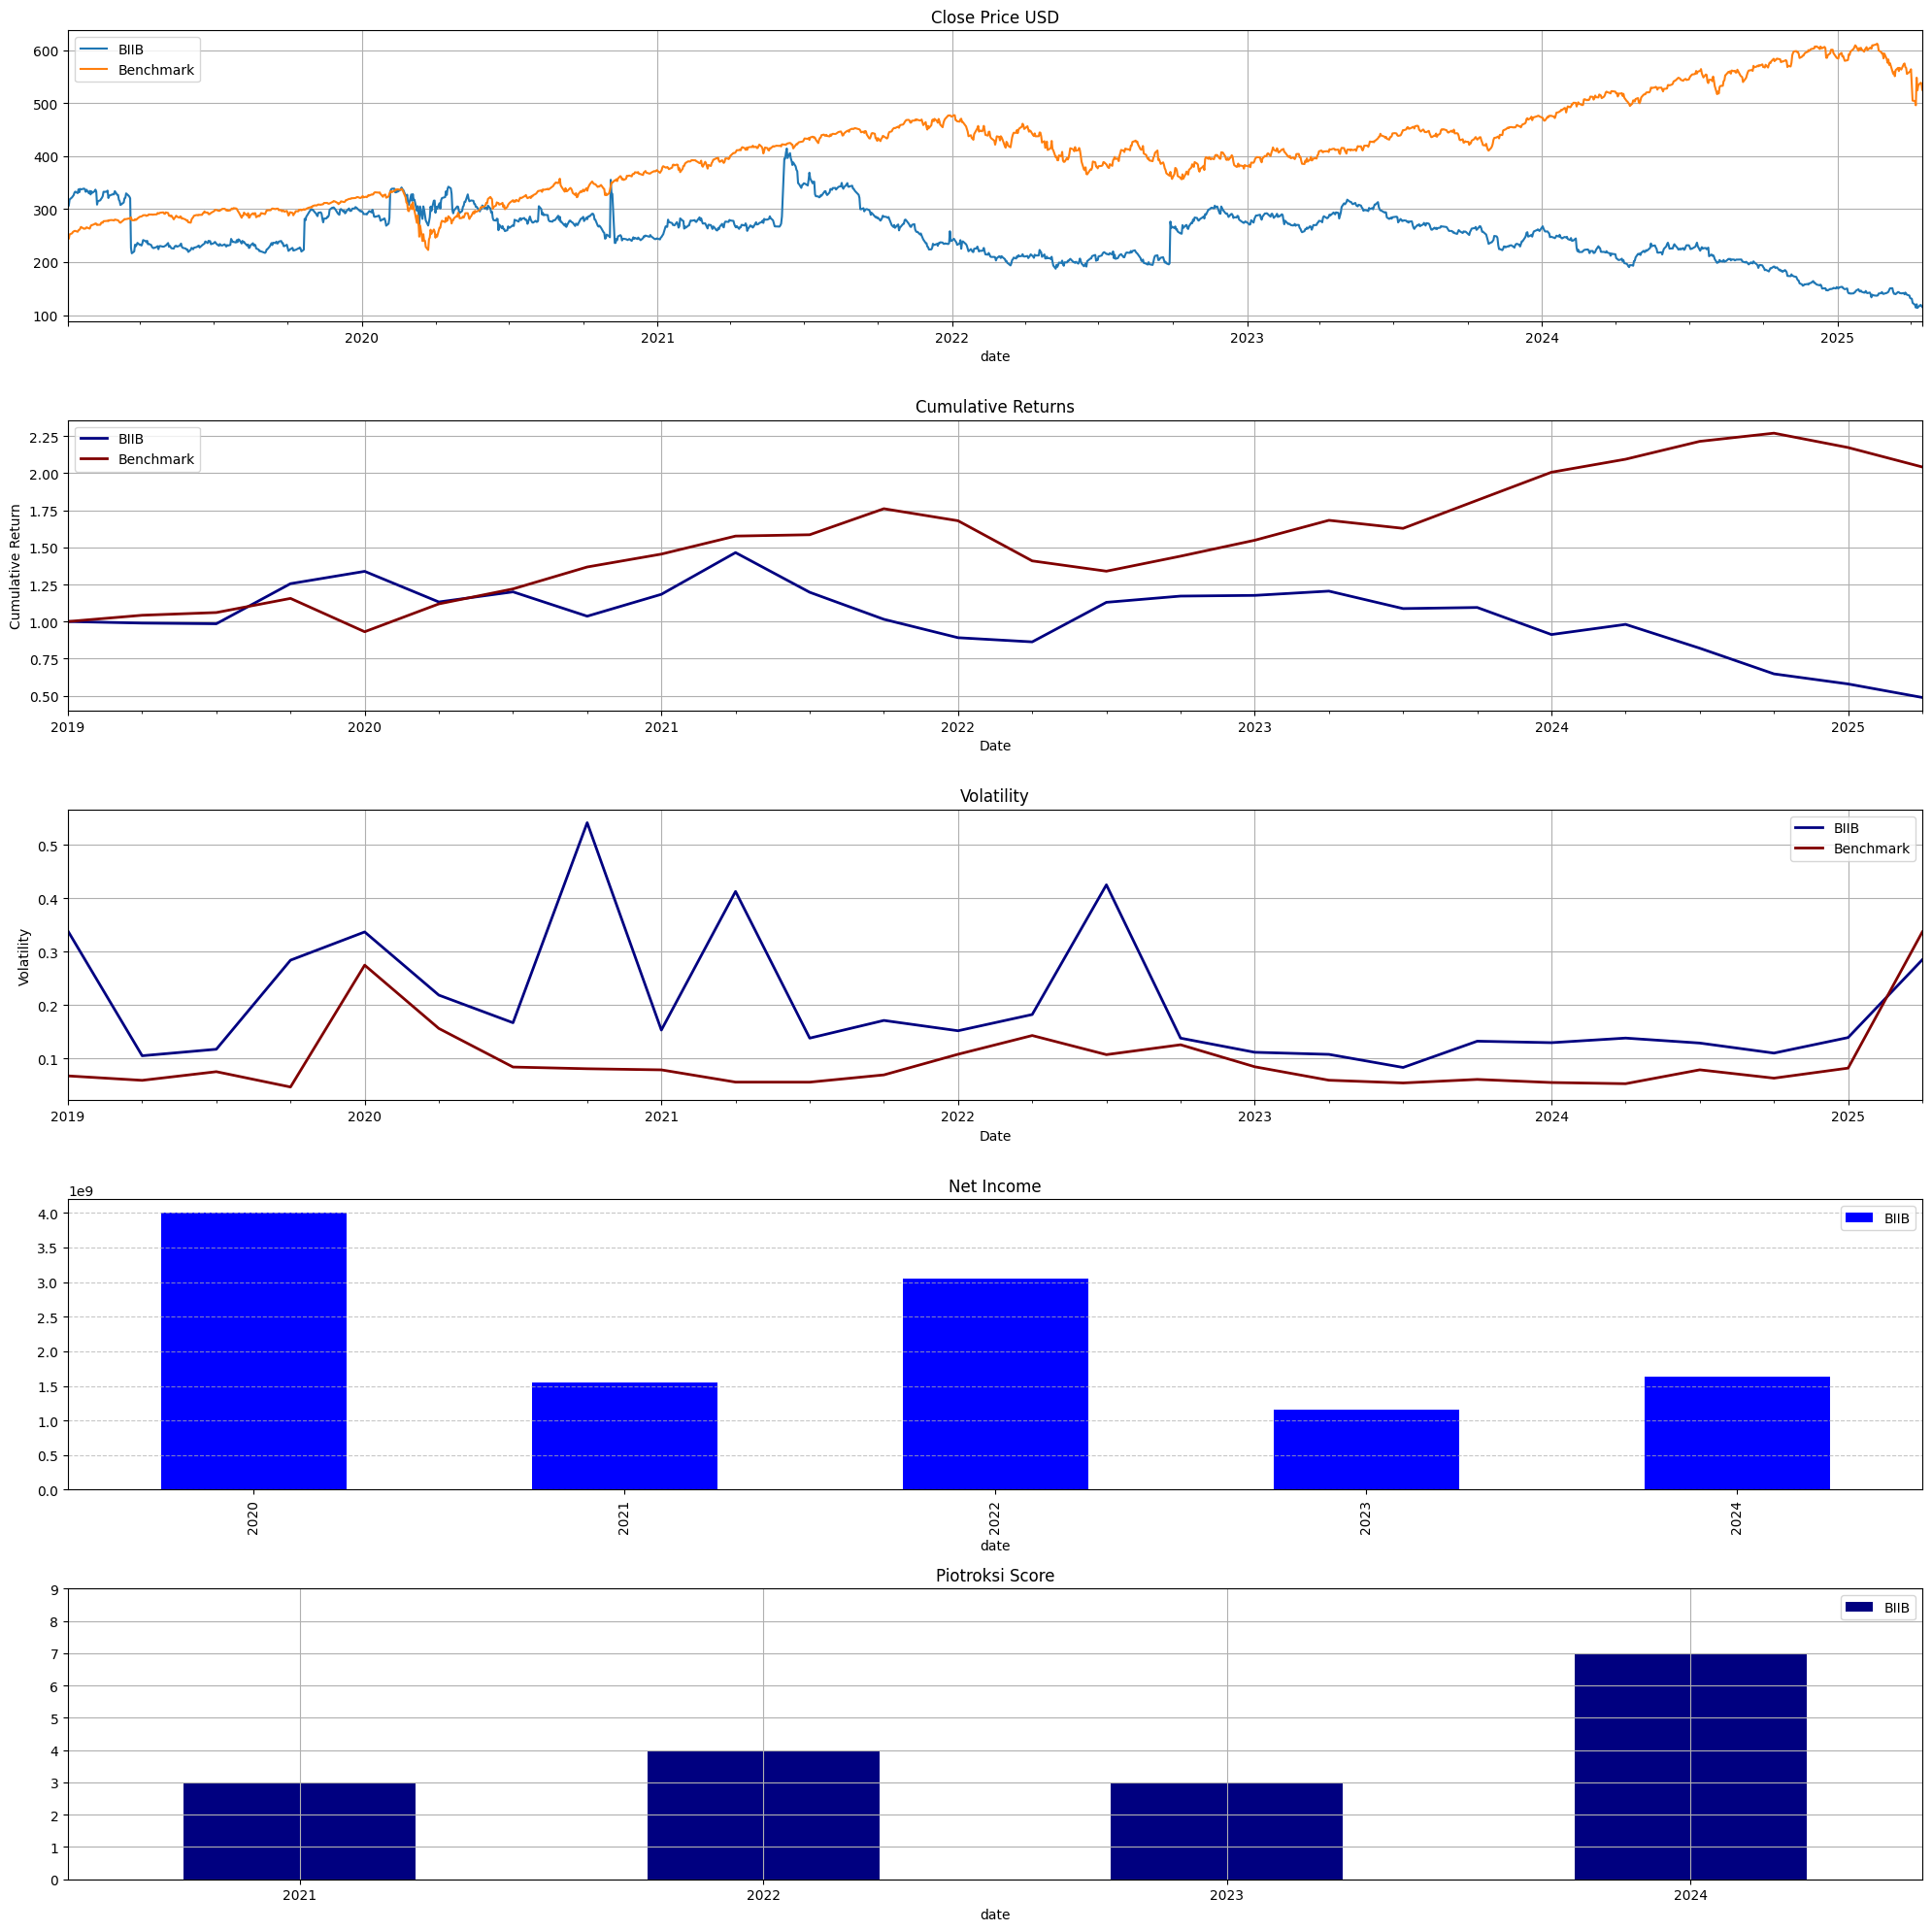
BIIB
BIOGEN INC. (Biological Products, (No Diagnostic Substances))
Fiscal year end : 1231 Report Date : 2024-12-31 Filing Date : 2025-02-12
BIOGEN INC.Consolidated Balance Sheets 2024 2023 2022 2021
──────────────────────────────────────────────────────────────────────────────────────────────────────
Accounts Receivable 14,048 16,641 17,050 15,494 Inventory 24,605 25,274 13,444 13,515 Total Current Assets 74,568 68,593 97,912 78,565 Property, Plant and Equipment 31,813 33,097 32,986 34,164 Goodwill 64,789 62,192 57,490 57,611 Other Assets 5,605 7,450 15,292 19,395 Total Assets 280,493 268,448 245,541 238,773 Accounts Payable 4,242 4,033 4,915 5,892 Total Current Liabilities 55,288 34,343 32,728 42,982 Long-term Liabilities 7,323 7,811 9,442 13,205 Total Liabilities 113,333 120,454 111,657 129,176 Commitments & Contingencies Other Comprehensive Income ( 1,362)( 1,537)( 1,649)( 1,067) Retained Earnings 192,598 176,276 164,665 139,117 Total Liabilities & Equity 280,493 268,448 245,541 238,773 Total Stockholders' Equity 147,994 133,979 108,962 Common Stock 1 1
BIOGEN INC.Consolidated Statement of Cash Flows 2024 2023 2022 2021 2020
──────────────────────────────────────────────────────────────────────────────────────────────────────────────────
Stock-based Compensation 2,912 2,642 2,541 2,386 1,983 Inventories ( 2,738)( 1,309)( 3,202)( 4,624)( 3,163) Net Cash from Operations 28,755 15,472 13,843 36,399 42,298 Capital Expenditures ( 1,537)( 2,770)( 2,403)( 2,581)( 4,248) Net Cash from Investing ( 7,992)( 41,010) 15,766( 5,637)( 6,086) Stock Repurchases -0 -0( 7,500)( 18,000)( 66,791) Net Cash from Financing ( 6,835) 1,493( 17,473)( 20,862)( 52,727)Total Cash and Equivalents 23,750 10,499 34,193 22,614 13,312Available durations for this statement:1 Month3 MonthsAnnual
Statistics for BIIB
Revenue
Net Income
Gross Margin %
Net Margin %
ROE %
ROA %
Loading ITables v2.3.0 from the init_notebook_mode cell...
(need help?)
Performance Details for BIIB
28
Loading ITables v2.3.0 from the init_notebook_mode cell...
(need help?)
Maximum Drawdown for BIIB
BIIB
Benchmark
Loading ITables v2.3.0 from the init_notebook_mode cell...
(need help?)
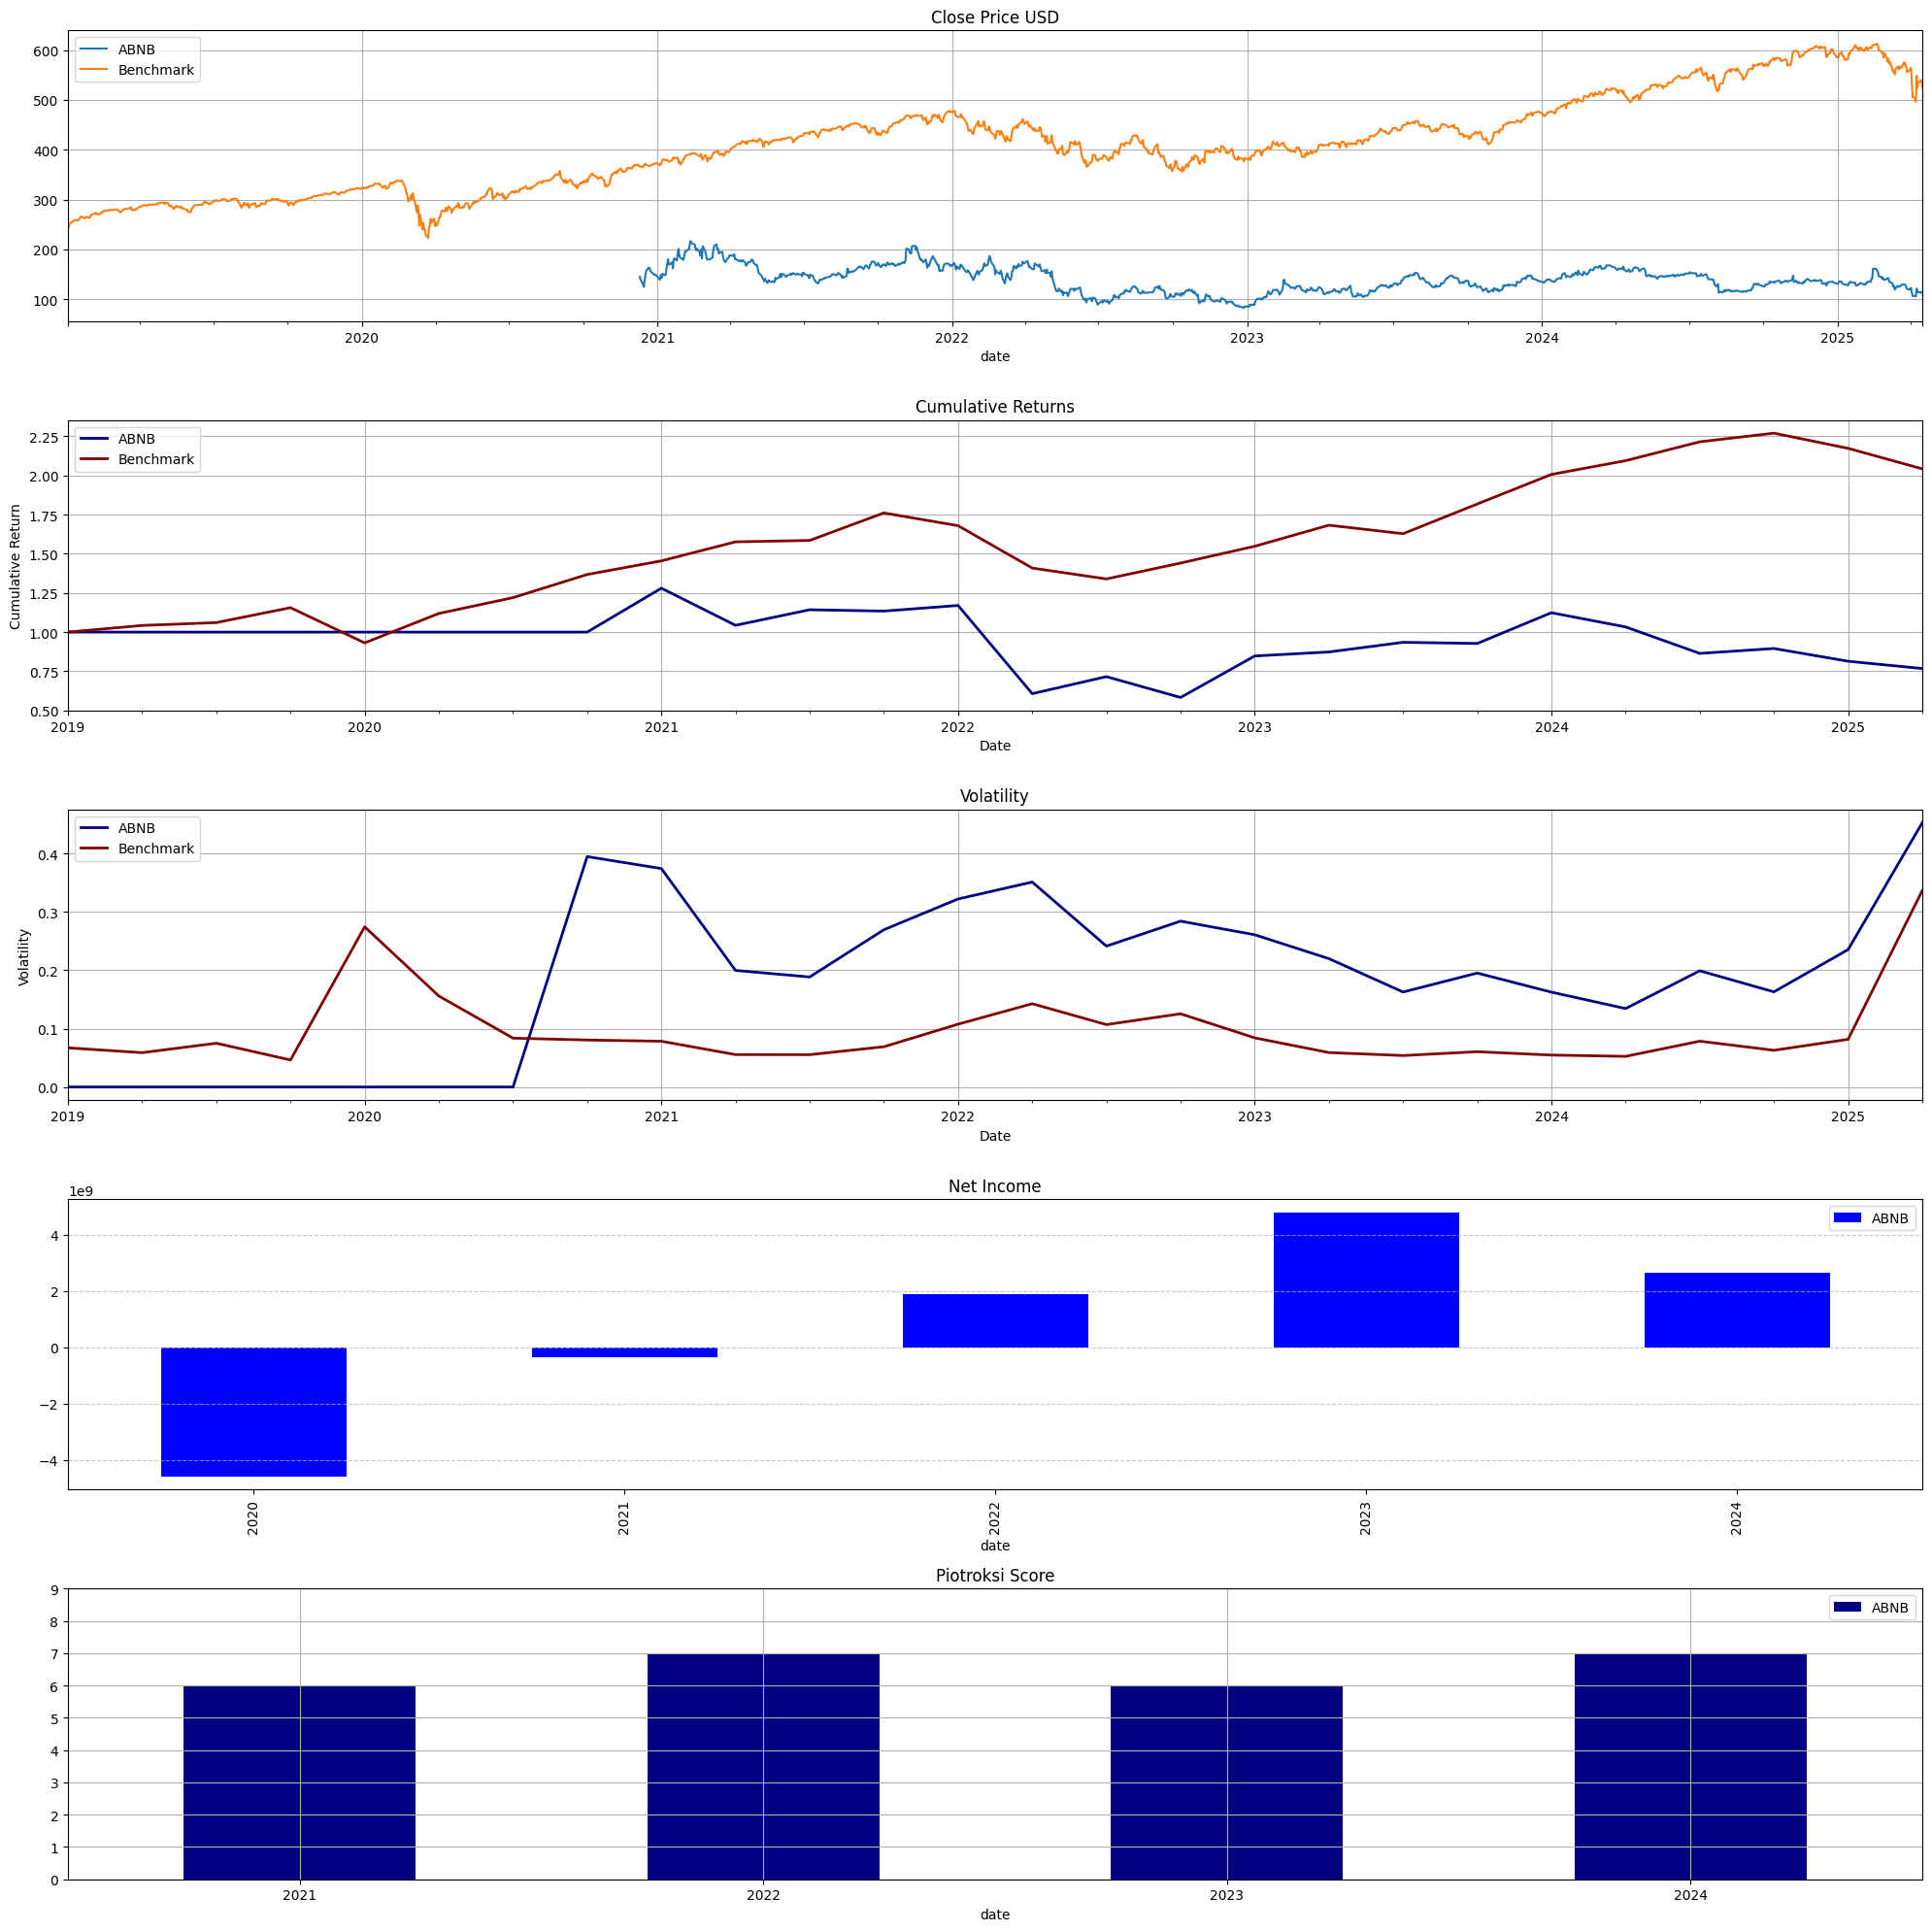
ABNB
Airbnb, Inc. (Services-To Dwellings & Other Buildings)
Fiscal year end : 1231 Report Date : 2024-12-31 Filing Date : 2025-02-13
Airbnb, Inc.Consolidated Balance Sheets 2024 2023 2022 2021
──────────────────────────────────────────────────────────────────────────────────────────────────────────────
Cash & Equivalents millions 6,864 6,874 7,378 6,067 Total Current Assets millions 17,180 16,509 14,861 12,386 Other Assets millions 563 463 477 188 Total Assets millions 20,959 20,645 16,038 13,708 Total Current Liabilities millions 10,161 9,950 7,978 6,359 Long-term Liabilities millions 391 539 218 219 Total Liabilities millions 12,547 12,480 10,478 8,933 Commitments & Contingencies Common Stock millions 0 0 0 0 Other Comprehensive Income millions 35( 49)( 32)( 7) Retained Earnings millions( 4,225)( 3,425)( 5,965)( 6,358) Total Stockholders' Equity millions 8,412 8,165 5,560 4,775 Total Liabilities & Equity millions 20,959 20,645 16,038 13,708 Property, Plant and Equipment millions 121 157 Goodwill millions 650 653 Accounts Payable millions 137 118
Airbnb, Inc.Income Statements 2024 2023 2022 2021 2020
──────────────────────────────────────────────────────────────────────────────────────────────────────────────────────────
Revenue millions 11,102 9,917 8,399 5,992 3,378 Research & Development millions 2,056 1,722 1,502 1,425 2,753Operating Income millions 2,553 1,518 1,802 429( 3,590)Pre-tax Income millions 3,331 2,102 1,989( 300)( 4,682)Income Tax millions( 683)( 2,690)( 96)( 52)( 97)Net Income millions 2,648 4,792 1,893( 352)( 4,585) Shares Basic millions 632 637 637 616 284 Shares Diluted millions 645 662 680 616 284
Airbnb, Inc.Consolidated Statement of Cash Flows 2024 2023 2022 2021 2020
──────────────────────────────────────────────────────────────────────────────────────────────────────────────────────────
Stock-based Compensation millions 1,407 1,120 930 899 3,003 Net Cash from Operations millions 4,518 3,884 3,430 2,313( 740) Net Cash from Investing millions( 616)( 1,042)( 28)( 1,352) 80 Stock Repurchases millions( 3,430)( 2,252)( 1,500) -0 -0 Net Cash from Financing millions( 3,572)( 2,430)( 689) 1,308 3,051Net Change in Cash millions 93 564 2,376 2,059 2,525Total Cash and Equivalents millions 12,760 12,667 12,103 9,727 7,668 Capital Expenditures millions( 25)( 25)( 37)Available durations for this statement:1 MonthAnnual
Statistics for ABNB
Revenue
Net Income
Gross Margin %
Net Margin %
ROE %
ROA %
Loading ITables v2.3.0 from the init_notebook_mode cell...
(need help?)
Performance Details for ABNB
29
Loading ITables v2.3.0 from the init_notebook_mode cell...
(need help?)
Maximum Drawdown for ABNB
ABNB
Benchmark
Loading ITables v2.3.0 from the init_notebook_mode cell...
(need help?)
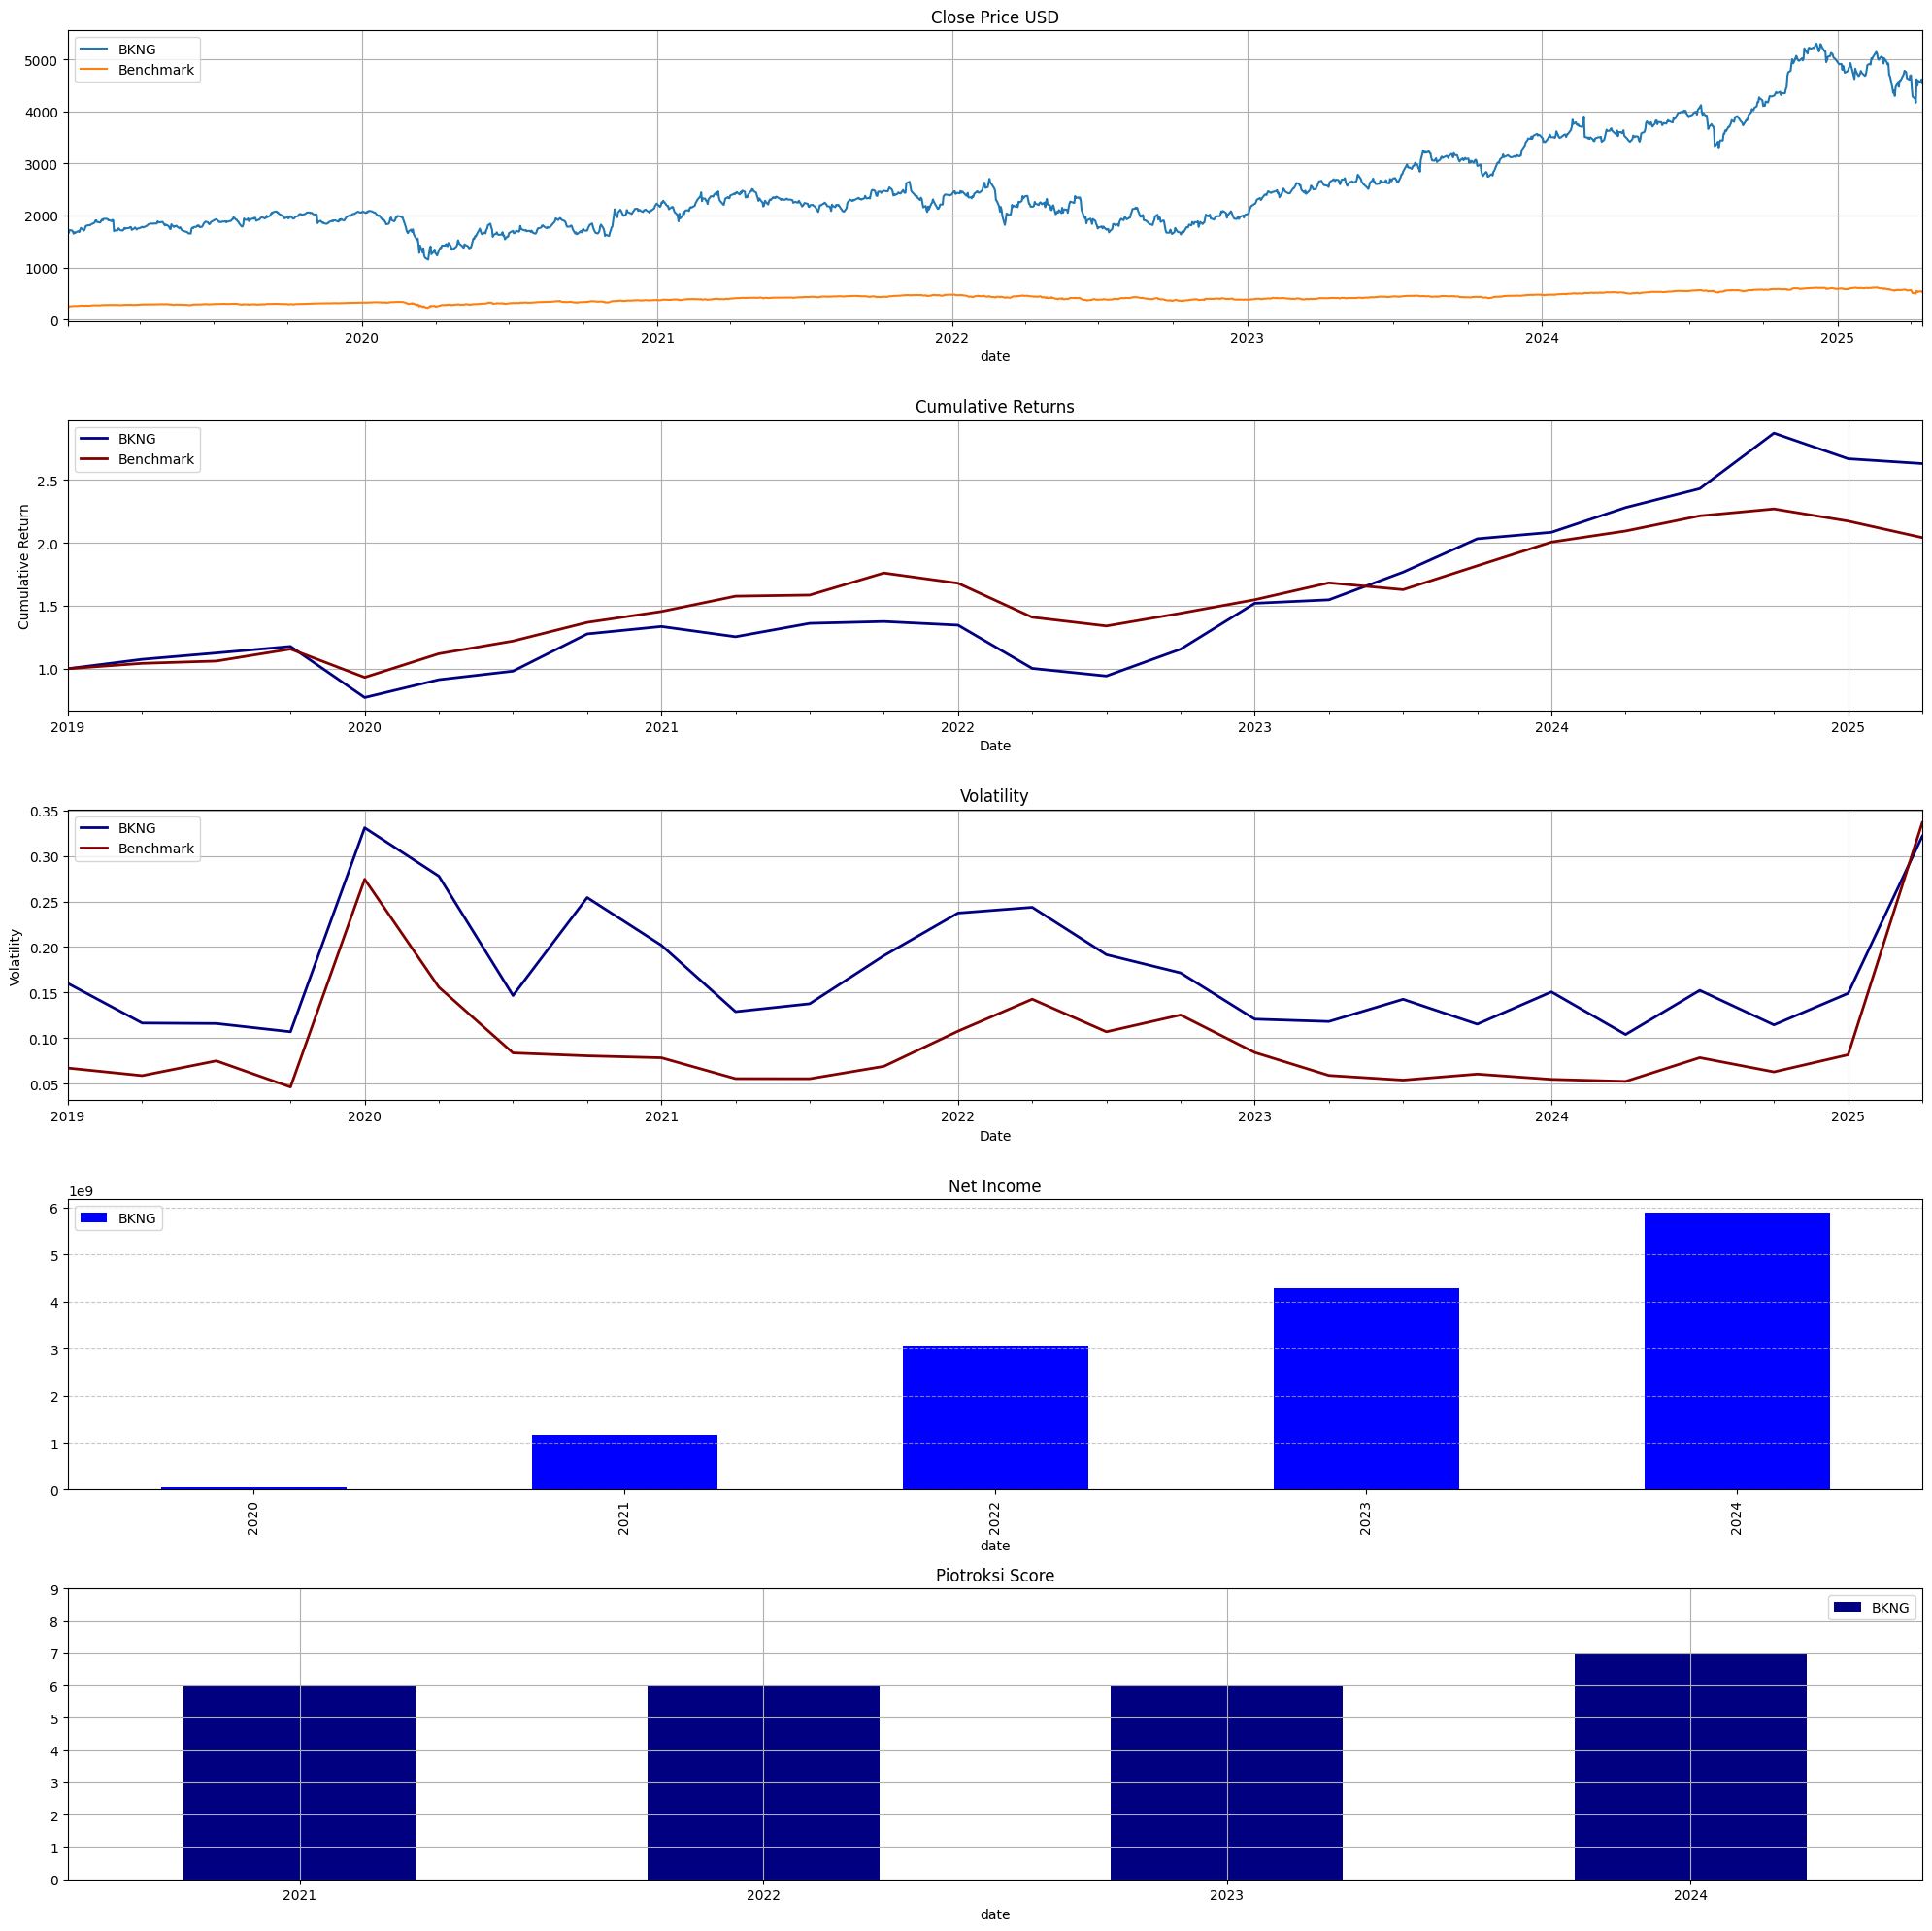
BKNG
Booking Holdings Inc. (Transportation Services)
Fiscal year end : 1231 Report Date : 2024-12-31 Filing Date : 2025-02-20
Booking Holdings Inc.Consolidated Balance Sheets 2024 2023 2022 2021
──────────────────────────────────────────────────────────────────────────────────────────────────────────────
Cash & Equivalents millions 16,164 12,107 12,221 11,127 Total Current Assets millions 20,491 17,034 15,798 13,145 Property, Plant and Equipment millions 832 784 669 822 Goodwill millions 2,799 2,826 2,807 2,887 Other Assets millions 1,109 940 824 1,059 Total Assets millions 27,708 24,342 25,361 23,641 Accounts Payable millions 3,824 3,374 2,507 1,586 Total Current Liabilities millions 15,647 13,330 8,474 6,246 Long-term Liabilities millions 199 161 172 199 Total Liabilities millions 31,728 27,086 22,579 17,463 Commitments & Contingencies Common Stock millions 0 0 0 0 Retained Earnings millions 36,525 31,830 27,541 24,453 Other Comprehensive Income millions( 375)( 323)( 267)( 144) Total Stockholders' Equity millions( 4,020)( 2,744) 2,782 6,178 Total Liabilities & Equity millions 27,708 24,342 25,361 23,641
Booking Holdings Inc.Income Statements 2024 2023 2022 2021 2020
───────────────────────────────────────────────────────────────────────────────────────────────────────────────────────────
Total Operating Expenses millions ( 16,184)( 15,530)( 11,988)( 8,462)( 7,427)Operating Income millions 7,555 5,835 5,102 2,496( 631)Pre-tax Income millions 7,292 5,481 3,923 1,465 567Income Tax millions ( 1,410)( 1,192)( 865)( 300)( 508)EPS Basic 174.96 118.67 76.7 28.39 1.45Shares Basic thousands 33,622 36,140 39,872 41,042 40,974EPS Diluted 172.69 117.4 76.35 28.17 1.44Shares Diluted thousands 34,064 36,530 40,052 41,362 41,160
Booking Holdings Inc.Consolidated Statement of Cash Flows 2024 2023 2022 2021 2020
──────────────────────────────────────────────────────────────────────────────────────────────────────────────────────────
Net Cash from Operations millions 8,323 7,344 6,554 2,820 85 Capital Expenditures millions( 429)( 345)( 368)( 304)( 286) Net Cash from Investing millions 129 1,486( 518)( 998) 2,637 Stock Repurchases millions( 6,509)( 10,377)( 6,621)( 163)( 1,303) Net Cash from Financing millions( 4,204)( 8,909)( 4,897)( 1,239) 1,528Net Change in Cash millions 4,058( 116) 1,099 570 4,250Total Cash and Equivalents millions 16,193 12,135 12,251 11,152 10,582
Statistics for BKNG
Revenue
Net Income
Gross Margin %
Net Margin %
ROE %
ROA %
Loading ITables v2.3.0 from the init_notebook_mode cell...
(need help?)
Performance Details for BKNG
30
Loading ITables v2.3.0 from the init_notebook_mode cell...
(need help?)
Maximum Drawdown for BKNG
BKNG
Benchmark
Loading ITables v2.3.0 from the init_notebook_mode cell...
(need help?)
CDW
CDW Corp (Retail-Catalog & Mail-Order Houses)
Fiscal year end : 1231 Report Date : 2024-12-31 Filing Date : 2025-02-21
CDW CORPConsolidated Balance Sheets 2024 2023 2022 2021
──────────────────────────────────────────────────────────────────────────────────────────────────────
Cash & Equivalents 5,035 5,887 3,152 2,581 Accounts Receivable 51,358 45,675 44,613 44,994 Inventory 6,053 6,681 8,002 9,276 Total Current Assets 73,731 67,050 65,640 64,781 Property, Plant and Equipment 1,920 1,955 1,888 1,958 Goodwill 46,204 44,134 43,427 43,829 Total Assets 146,784 132,846 131,315 131,994 Total Current Liabilities 54,744 54,420 49,471 50,960 Commitments & Contingencies Common Stock 13 13 14 13 Retained Earnings ( 13,229)( 15,255)( 17,638)( 25,707) Other Comprehensive Income ( 1,601)( 1,246)( 1,524)( 944) Total Stockholders' Equity 23,527 20,425 16,033 7,057 Total Liabilities & Equity 146,784 132,846 131,315 131,994 Other Assets 4,722 3,961 3,589 Long-term Liabilities 4,329 3,361 2,354
CDW CORPConsolidated Statement of Cash Flows 2024 2023 2022 2021 2020
──────────────────────────────────────────────────────────────────────────────────────────────────────────────────
Inventories ( 611)( 1,390)( 1,119)( 1,510)( 714) Net Cash from Operations 12,773 15,987 13,359 7,846 13,143 Capital Expenditures ( 1,226)( 1,482)( 1,278)( 1,000)( 1,580) Net Cash from Investing ( 6,592)( 2,296)( 1,645)( 27,696)( 2,010) Stock Repurchases ( 5,000)( 5,000) -0( 15,004)( 3,406) Net Cash from Financing ( 6,869)( 10,987)( 11,021) 8,328 1,388Net Change in Cash ( 810) 2,735 571( 11,521) 12,562Total Cash and Equivalents 5,077 5,887 3,152 2,581 14,102
Statistics for CDW
Revenue
Net Income
Gross Margin %
Net Margin %
ROE %
ROA %
Loading ITables v2.3.0 from the init_notebook_mode cell...
(need help?)
Performance Details for CDW
31
Loading ITables v2.3.0 from the init_notebook_mode cell...
(need help?)
Maximum Drawdown for CDW
CDW
Benchmark
Loading ITables v2.3.0 from the init_notebook_mode cell...
(need help?)
AAPL
Apple Inc. (Electronic Computers)
Fiscal year end : 0927 Report Date : 2024-09-28 Filing Date : 2024-11-01
Apple Inc.Consolidated Balance Sheets 2024 2023 2022 2021
────────────────────────────────────────────────────────────────────────────────────────────────────────────
Cash & Equivalents millions 29,943 29,965 23,646 34,940 Accounts Receivable millions 33,410 29,508 28,184 26,278 Inventory millions 7,286 6,331 4,946 6,580 Total Current Assets millions 152,987 143,566 135,405 134,836 Property, Plant and Equipment millions 45,680 43,715 42,117 39,440 Other Assets millions 74,834 64,758 54,428 48,849 Total Assets millions 364,980 352,583 352,755 351,002 Accounts Payable millions 68,960 62,611 64,115 54,763 Total Current Liabilities millions 176,392 145,308 153,982 125,481 Long-term Liabilities millions 45,888 49,848 49,142 53,325 Total Liabilities millions 308,030 290,437 302,083 287,912 Commitments & Contingencies Retained Earnings millions( 19,154)( 214)( 3,068) 5,562 Other Comprehensive Income millions( 7,172)( 11,452)( 11,109) 163 Total Stockholders' Equity millions 56,950 62,146 50,672 63,090 Total Liabilities & Equity millions 364,980 352,583 352,755 351,002
Apple Inc.Income Statements 2024 2023 2022 2021 2020
───────────────────────────────────────────────────────────────────────────────────────────────────────────────────────────
Revenue millions 294,866 298,085 316,199 365,817 53,768Cost of Sales millions ( 210,352)( 214,137)( 223,546)( 212,981)( 169,559) Research & Development millions 31,370 29,915 26,251 21,914 18,752 Selling, General & Admin millions 26,097 24,932 25,094 21,973 19,916 Total Operating Expenses millions ( 57,467)( 54,847)( 51,345)( 43,887)( 38,668)Operating Income millions 123,216 114,301 119,437 108,949 66,288Pre-tax Income millions 123,485 113,736 119,103 109,207 67,091Income Tax millions ( 29,749)( 16,741)( 19,300)( 14,527)( 9,680)Net Income millions 93,736 96,995 99,803 94,680 57,411 EPS Basic 6.11 6.16 6.15 5.67 3.31 EPS Diluted 6.08 6.13 6.11 5.61 3.28 Shares Basic thousands15,343,78315,744,23116,215,96316,701,27217,352,119 Shares Diluted thousands15,408,09515,812,54716,325,81916,864,91917,528,214
Apple Inc.Consolidated Statement of Cash Flows 2024 2023 2022 2021 2020
──────────────────────────────────────────────────────────────────────────────────────────────────────────────────────────
Total Cash and Equivalents millions 29,943 30,737 24,977 35,929 39,789 Stock-based Compensation millions 11,688 10,833 9,038 7,906 6,829 Inventories millions( 1,046)( 1,618)( 1,484)( 2,642)( 127) Net Cash from Operations millions 118,254 110,543 122,151 104,038 80,674 Capital Expenditures millions( 9,447)( 10,959)( 10,708)( 11,085)( 7,309) Net Cash from Investing millions 2,935 3,705( 22,354)( 14,545)( 4,289) Stock Repurchases millions( 94,949)( 77,550)( 89,402)( 85,971)( 72,358) Net Cash from Financing millions( 121,983)( 108,488)( 110,749)( 93,353)( 86,820)Net Change in Cash millions( 794) 5,760( 10,952)( 3,860)( 10,435)
Statistics for AAPL
Revenue
Net Income
Gross Margin %
Net Margin %
ROE %
ROA %
Loading ITables v2.3.0 from the init_notebook_mode cell...
(need help?)
Insights for AAPL
Debt-to-Equity above 3.0 (high leverage)
Performance Details for AAPL
32
Loading ITables v2.3.0 from the init_notebook_mode cell...
(need help?)
Maximum Drawdown for AAPL
AAPL
Benchmark
Loading ITables v2.3.0 from the init_notebook_mode cell...
(need help?)
CMCSA
COMCAST CORP (Cable & Other Pay Television Services)
Fiscal year end : 1231 Report Date : 2024-12-31 Filing Date : 2025-01-31
COMCAST CORPORATIONConsolidated Balance Sheets 2024 2023 2022 2021
────────────────────────────────────────────────────────────────────────────────────────────────────────────
Cash & Equivalents millions 7,322 6,215 4,749 8,711 Accounts Receivable millions 13,661 13,813 12,672 12,008 Total Current Assets millions 26,801 23,987 21,826 24,807 Property, Plant and Equipment 625 597 555 540 Goodwill 582 593 585 702 Other Assets millions 12,501 12,333 12,497 12,424 Total Assets millions 266,211 264,811 257,275 275,905 Accounts Payable millions 11,321 12,437 12,544 12,455 Total Current Liabilities millions 39,581 40,198 27,887 29,348 Long-term Liabilities millions 20,942 20,122 20,395 20,620 Commitments & Contingencies Common Stock millions 0 0 0 0 Retained Earnings millions 56,972 52,892 51,609 61,902 Other Comprehensive Income millions( 2,043)( 1,253)( 2,611) 1,480 Total Stockholders' Equity millions 85,560 82,703 80,943 96,092 Total Liabilities & Equity millions 266,211 264,811 257,275 275,905
COMCAST CORPORATIONIncome Statements 2024 2023 2022 2021 2020
──────────────────────────────────────────────────────────────────────────────────────────────────────────────────────────
Revenue millions 123,731 121,572 121,427Operating Income millions 23,297 23,314 14,041 20,817 17,493Pre-tax Income millions 18,673 20,478 9,284 19,093 14,065Income Tax millions( 2,796)( 5,371)( 4,359)( 5,259)( 3,364)Net Income millions 16,192 15,388 5,370 14,159 10,534EPS Basic 4.17 3.73 1.22 3.09 2.3EPS Diluted 4.14 3.71 1.21 3.04 2.28
COMCAST CORPORATIONConsolidated Statement of Cash Flows 2024 2023 2022 2021 2020
──────────────────────────────────────────────────────────────────────────────────────────────────────────────────────────
Stock-based Compensation millions 1,288 1,241 1,336 1,315 1,193 Net Cash from Operations millions 27,673 28,501 26,413 29,146 24,737 Capital Expenditures millions( 12,181)( 12,242)( 10,626)( 9,174)( 9,179) Net Cash from Investing millions( 15,670)( 7,161)( 14,140)( 13,446)( 12,047) Stock Repurchases millions( 9,103)( 11,291)( 13,328)( 4,672)( 534) Net Cash from Financing millions( 10,883)( 19,850)( 16,184)( 18,618)( 6,513)Net Change in Cash millions 1,095 1,500( 3,997)( 2,989) 6,179Total Cash and Equivalents millions 7,377 6,282 4,782 8,778 11,768Available durations for this statement:3 MonthsAnnual
Statistics for CMCSA
Revenue
Net Income
Gross Margin %
Net Margin %
ROE %
ROA %
Loading ITables v2.3.0 from the init_notebook_mode cell...
(need help?)
Insights for CMCSA
ROE < 5.0%
ROA < 2.0%
Performance Details for CMCSA
33
Loading ITables v2.3.0 from the init_notebook_mode cell...
(need help?)
Maximum Drawdown for CMCSA
CMCSA
Benchmark
Loading ITables v2.3.0 from the init_notebook_mode cell...
(need help?)
NVDA
NVIDIA CORP (Semiconductors & Related Devices)
Fiscal year end : 0125 Report Date : 2025-01-26 Filing Date : 2025-02-26
NVIDIA CORPConsolidated Balance Sheets 2025 2024 2023 2022
──────────────────────────────────────────────────────────────────────────────────────────────────────────
Cash & Equivalents millions 8,589 7,280 3,389 1,990 Accounts Receivable millions 23,065 9,999 3,827 4,650 Inventory millions 10,080 5,282 5,159 2,605 Total Current Assets millions 80,126 44,345 23,073 28,829 Property, Plant and Equipment millions 6,283 3,914 3,807 2,778 Goodwill 52 44 44 44 Other Assets millions 6,425 4,500 3,820 3,841 Total Assets millions 111,601 65,728 41,182 44,187 Accounts Payable millions 6,310 2,699 1,193 1,783 Total Current Liabilities millions 18,047 10,631 6,563 4,335 Long-term Liabilities millions 4,245 2,541 1,913 1,553 Total Liabilities millions 32,274 22,750 19,081 17,575 Commitments & Contingencies millions 0 0 Common Stock millions 24 25 2 3 Other Comprehensive Income millions 28 27( 43)( 11) Retained Earnings millions 68,038 29,817 10,171 16,235 Total Stockholders' Equity millions 79,327 42,978 22,101 26,612 Total Liabilities & Equity millions 111,601 65,728 41,182 44,187
NVIDIA CORPIncome Statements 2025 2024 2023 2022 2021
──────────────────────────────────────────────────────────────────────────────────────────────────────────────────────────
Research & Development millions 12,914 8,675 7,339 5,268 3,924 Selling, General & Admin millions 3,491 2,654 2,440 2,166 1,940 Total Operating Expenses millions( 16,405)( 11,329)( 11,132)( 7,434)( 5,864)Operating Income millions 81,453 32,972 4,224 10,041 4,532Pre-tax Income millions 84,026 33,818 4,181 9,941 4,409Income Tax millions( 11,146)( 4,058)( 187)( 189)( 77)Net Income millions 72,880 29,760 4,368 9,752 4,332 EPS Basic 2.97 1.21 0.18 3.91 1.76 EPS Diluted 2.94 1.19 0.17 3.85 1.73 Shares Basic millions 24,555 24,690 24,870 2,496 2,467 Shares Diluted millions 24,804 24,940 25,070 2,535 2,510
NVIDIA CORPConsolidated Statement of Cash Flows 2025 2024 2023 2022 2021
──────────────────────────────────────────────────────────────────────────────────────────────────────────────────────────
Stock-based Compensation millions( 4,737)( 3,549)( 2,709)( 2,004)( 1,397) Inventories millions( 4,781)( 98)( 2,554)( 774)( 524) Net Cash from Operations millions 64,089 28,090 5,641 9,108 5,822 Net Cash from Investing millions( 20,421)( 10,566) 7,375( 9,830)( 19,675) Stock Repurchases millions( 33,706)( 9,533)( 10,039) -0 -0 Net Cash from Financing millions( 42,359)( 13,633)( 11,617) 1,865 3,804Net Change in Cash millions 1,309 3,891 1,399 1,143( 10,049)Total Cash and Equivalents millions 8,589 7,280 3,389 1,990 847
Statistics for NVDA
Revenue
Net Income
Gross Margin %
Net Margin %
ROE %
ROA %
Loading ITables v2.3.0 from the init_notebook_mode cell...
(need help?)
Performance Details for NVDA
34
Loading ITables v2.3.0 from the init_notebook_mode cell...
(need help?)
Maximum Drawdown for NVDA
NVDA
Benchmark
Loading ITables v2.3.0 from the init_notebook_mode cell...
(need help?)
MDB
MongoDB, Inc. (Services-Prepackaged Software)
Fiscal year end : 0131 Report Date : 2025-01-31 Filing Date : 2025-03-21
MONGODB, INC.Consolidated Statement of Cash Flows 2025 2024 2023 2022 2021
───────────────────────────────────────────────────────────────────────────────────────────────────────────────────────────
Stock-based Compensation thousands 493,940 456,907 381,454 251,069 149,313 Net Cash from Operations thousands 150,191 121,477( 12,970) 6,980( 42,673) Capital Expenditures thousands( 29,550)( 6,074)( 7,244)( 8,072)( 11,773) Net Cash from Investing thousands( 657,440) 188,019( 33,308)( 852,142)( 262,656) Net Cash from Financing thousands 202,060 38,241 30,200 890,892 27,581Net Change in Cash thousands( 310,890) 347,304( 18,081) 44,198( 276,484)Total Cash and Equivalents thousands 492,753 803,643 456,339 474,420 430,222 Stock Repurchases thousands -0 -0( 11)Available durations for this statement:1 MonthAnnual
Statistics for MDB
Revenue
Net Income
Gross Margin %
Net Margin %
ROE %
ROA %
Loading ITables v2.3.0 from the init_notebook_mode cell...
(need help?)
Performance Details for MDB
35
Loading ITables v2.3.0 from the init_notebook_mode cell...
(need help?)
Maximum Drawdown for MDB
MDB
Benchmark
Loading ITables v2.3.0 from the init_notebook_mode cell...
(need help?)
WBD
Warner Bros. Discovery, Inc. (Cable & Other Pay Television Services)
Fiscal year end : 1231 Report Date : 2024-12-31 Filing Date : 2025-02-27
Warner Bros. Discovery, Inc.Consolidated Balance Sheets 2024 2023 2022 2021
──────────────────────────────────────────────────────────────────────────────────────────────────────────────
Cash & Equivalents millions 5,312 3,780 3,731 3,905 Total Current Assets millions 14,078 14,218 13,999 7,264 Goodwill millions 25,667 34,969 34,438 12,912 Other Assets millions 7,327 8,099 8,629 2,766 Total Assets millions 104,560 122,757 134,001 34,427 Accounts Payable millions 1,055 1,260 1,454 412 Total Current Liabilities millions 15,810 15,332 15,017 3,459 Long-term Liabilities millions 10,070 10,328 10,669 1,927 Total Liabilities millions 69,622 76,285 85,334 21,031 Commitments & Contingencies Common Stock millions 27 27 27 0 Retained Earnings millions( 12,239)( 928) 2,205 9,580 Other Comprehensive Income millions( 1,067)( 741)( 1,523)( 830) Total Stockholders' Equity millions 34,037 45,226 47,095 11,599 Total Liabilities & Equity millions 104,560 122,757 134,001 34,427
Warner Bros. Discovery, Inc.Income Statements 2024 2023 2022 2021 2020
──────────────────────────────────────────────────────────────────────────────────────────────────────────────────────────
Revenue millions 8,090 8,700 8,524 12,191 10,671 Selling, General & Admin millions 9,296 9,696 9,678 4,016 2,722Operating Income millions( 10,032)( 1,548)( 7,370) 2,012 2,515Pre-tax Income millions( 11,388)( 3,863)( 8,960) 1,433 1,728Income Tax millions( 94)( 784)( 1,663)( 236)( 373)Net Income millions( 11,311)( 3,126)( 7,371) 1,006 1,219 EPS Basic ( 4.62)( 1.28)( 3.82) 1.55 1.82 EPS Diluted ( 4.62)( 1.28)( 3.82) 1.54 1.81 Shares Basic millions 2,450 2,436 1,940 588 599 Shares Diluted millions 2,450 2,436 1,940 664 672Available durations for this statement:1 MonthAnnual
Warner Bros. Discovery, Inc.Consolidated Statement of Cash Flows 2024 2023 2022 2021 2020
──────────────────────────────────────────────────────────────────────────────────────────────────────────────────────────
Stock-based Compensation millions 557 500 412 178 110 Net Cash from Operations millions 5,375 7,477 4,304 2,798 2,739 Capital Expenditures millions( 948)( 1,316)( 987)( 373)( 402) Net Cash from Investing millions( 349)( 1,259) 3,524( 56)( 703) Net Cash from Financing millions( 3,749)( 5,837)( 7,742)( 853)( 1,549)Net Change in Cash millions 1,097 389 25 1,783 570Total Cash and Equivalents millions 5,416 4,319 3,930 3,905 2,122Available durations for this statement:1 MonthAnnual
Statistics for WBD
Revenue
Net Income
Gross Margin %
Net Margin %
ROE %
ROA %
Loading ITables v2.3.0 from the init_notebook_mode cell...
(need help?)
Netflix, Inc.Consolidated Statement of Cash Flows 2024 2023 2022 2021 2020
───────────────────────────────────────────────────────────────────────────────────────────────────────────────────────────────
Stock-based Compensation thousands 272,588 339,368 575,452 403,220 415,180 Net Cash from Operations thousands 7,361,364 7,274,301 2,026,257 392,610 2,427,077 Capital Expenditures thousands ( 439,538) ( 348,552) ( 407,729) ( 524,585)( 497,923) Net Cash from Investing thousands(2,181,784) 541,751(2,076,392)(1,339,853)( 505,354) Stock Repurchases thousands(6,263,746)(6,045,347) -0 ( 600,022) -0 Net Cash from Financing thousands(4,074,427)(5,950,803) ( 664,254)(1,149,776) 1,237,311Net Change in Cash thousands 688,822 1,947,933 ( 884,529)(2,183,759) 3,195,084Total Cash and Equivalents thousands 7,807,337 7,118,515 5,170,582 6,055,111 8,238,870
Statistics for NFLX
Revenue
Net Income
Gross Margin %
Net Margin %
ROE %
ROA %
Loading ITables v2.3.0 from the init_notebook_mode cell...
(need help?)
Performance Details for NFLX
37
Loading ITables v2.3.0 from the init_notebook_mode cell...
(need help?)
Maximum Drawdown for NFLX
NFLX
Benchmark
Loading ITables v2.3.0 from the init_notebook_mode cell...
(need help?)
XEL
XCEL ENERGY INC (Electric & Other Services Combined)
Fiscal year end : 1231 Report Date : 2024-12-31 Filing Date : 2025-02-27
XCEL ENERGY INCConsolidated Balance Sheets 2024 2023 2022 2021
──────────────────────────────────────────────────────────────────────────────────────────────────────────────
Accounts Receivable millions 1,249 1,315 1,373 1,018 Total Current Assets millions 4,325 4,069 5,144 4,239 Property, Plant and Equipment millions 57,198 51,642 48,253 45,457 Other Assets millions 635 678 389 431 Total Assets millions 70,035 64,079 61,188 57,851 Accounts Payable millions 1,781 1,668 1,804 1,409 Total Current Liabilities millions 6,459 5,652 6,078 5,046 Long-term Liabilities millions 89 148 147 158 Commitments & Contingencies Common Stock millions 1,436 1,387 1,374 1,360 Retained Earnings millions 8,553 7,858 7,239 6,572 Other Comprehensive Income millions( 68)( 94)( 93)( 123) Total Stockholders' Equity millions 19,522 17,616 16,675 15,612 Total Liabilities & Equity millions 70,035 64,079 61,188 57,851
XCEL ENERGY INCIncome Statements 2024 2023 2022 20212020
────────────────────────────────────────────────────────────────────────────────────────────────────────────────────
Operating Income millions 2,386 2,481 2,428 2,203Pre-tax Income millions 1,534 1,625 1,601 1,527Income Tax millions( 402)( 146)( 135)( 70)Net Income millions 1,936 1,771 1,736 1,597 Shares Basic millions 563 552 547 539 Shares Diluted millions 563 552 547 540 EPS Basic 3.44 3.21 3.18 2.96 EPS Diluted 3.44 3.21 3.17 2.96
XCEL ENERGY INCConsolidated Statement of Cash Flows 2024 2023 2022 2021 2020
──────────────────────────────────────────────────────────────────────────────────────────────────────────────────────────
Stock-based Compensation millions 33 25 20 31 73 Inventories millions( 140)( 98)( 203)( 126)( 80) Net Cash from Operations millions 4,641 5,327 3,932 2,189 2,848 Net Cash from Investing millions( 7,428)( 5,926)( 4,653)( 4,287)( 4,740) Net Cash from Financing millions 2,837 617 666 2,135 1,773Net Change in Cash millions 50 18( 55) 37( 119)Total Cash and Equivalents millions 179 129 111 166 129
Statistics for XEL
Revenue
Net Income
Gross Margin %
Net Margin %
ROE %
ROA %
Loading ITables v2.3.0 from the init_notebook_mode cell...
(need help?)
Insights for XEL
ROE < 5.0%
Net Debt/EBITDA above 3.5 (heavy leverage).
Performance Details for XEL
38
Loading ITables v2.3.0 from the init_notebook_mode cell...
(need help?)
Maximum Drawdown for XEL
XEL
Benchmark
Loading ITables v2.3.0 from the init_notebook_mode cell...
(need help?)
SNPS
SYNOPSYS INC (Services-Prepackaged Software)
Fiscal year end : 1031 Report Date : 2024-10-31 Filing Date : 2024-12-19
SYNOPSYS, INC.Consolidated Balance Sheets 2024 2023 2022 2021
───────────────────────────────────────────────────────────────────────────────────────────────────────────────
Cash & Equivalents thousands 3,896,532 1,433,966 1,417,608 1,432,840 Accounts Receivable thousands 934,470 856,660 796,091 568,501 Inventory thousands 361,849 325,590 211,927 229,023 Total Current Assets thousands 6,469,666 3,430,624 3,012,669 2,808,341 Property, Plant and Equipment thousands 563,006 549,837 483,300 472,398 Goodwill thousands 3,448,850 3,346,065 3,842,234 3,575,785 Other Assets thousands 583,700 444,820 463,695 510,698 Total Assets thousands13,073,56110,333,131 9,418,087 8,752,260 Total Current Liabilities thousands 2,650,120 2,985,451 2,774,499 2,413,484 Long-term Liabilities thousands 469,738 381,531 327,829 391,433 Total Liabilities thousands 4,050,355 4,148,830 3,858,897 3,453,317 Common Stock thousands 1,541 1,521 1,524 1,531 Retained Earnings thousands 8,984,105 6,741,699 5,534,307 4,549,713 Other Comprehensive Income thousands( 180,380)( 196,414)( 234,277)( 49,604) Total Stockholders' Equity thousands 8,990,702 6,147,308 5,515,725 5,295,137 Total Liabilities & Equity thousands13,073,56110,333,131 9,418,087 8,752,260
MONSTER BEVERAGE CORPORATIONConsolidated Statement of Cash Flows 2024 2023 2022 2021 2020
────────────────────────────────────────────────────────────────────────────────────────────────────────────────────────────
Stock-based Compensation thousands 90,985 68,836 64,109 70,483 70,289 Inventories thousands ( 211,503)( 7,898)( 347,712)( 277,793)( 30,304) Net Cash from Operations thousands 1,928,533 1,717,753 887,699 1,155,741 1,364,163 Capital Expenditures thousands ( 264,074)( 221,428)( 188,726)( 43,868)( 48,722) Net Cash from Investing thousands 733,727( 193,395)( 161,367)( 992,022)( 472,487) Stock Repurchases thousands(3,771,875)( 658,952)( 771,028)( 13,830)( 595,918) Net Cash from Financing thousands(3,329,029)( 542,599)( 706,938) 34,821( 526,068)Net Change in Cash thousands ( 764,388) 990,534( 19,321) 146,049 382,456Total Cash and Equivalents thousands 1,533,287 2,297,675 1,307,141 1,326,462 1,180,413
Statistics for MNST
Revenue
Net Income
Gross Margin %
Net Margin %
ROE %
ROA %
Loading ITables v2.3.0 from the init_notebook_mode cell...
(need help?)
Performance Details for MNST
43
Loading ITables v2.3.0 from the init_notebook_mode cell...
(need help?)
Maximum Drawdown for MNST
MNST
Benchmark
Loading ITables v2.3.0 from the init_notebook_mode cell...
(need help?)
MELI
MERCADOLIBRE INC (Services-Business Services, NEC)
Fiscal year end : 1231 Report Date : 2024-12-31 Filing Date : 2025-02-21
MercadoLibre, Inc.Consolidated Balance Sheets 2024 2023 2022 2021
──────────────────────────────────────────────────────────────────────────────────────────────────────────────
Cash & Equivalents millions 2,635 2,556 1,910 2,585 Accounts Receivable millions 255 156 130 98 Inventory millions 296 238 152 253 Total Current Assets millions 20,142 14,260 10,953 8,175 Goodwill millions 149 163 153 148 Other Assets millions 182 68 256 134 Total Assets millions 25,196 17,612 13,736 10,101 Total Current Liabilities millions 16,603 11,263 8,562 5,837 Long-term Liabilities millions 216 200 95 62 Total Liabilities millions( 20,845)( 14,541)( 11,909)( 8,570) Commitments & Contingencies Common Stock millions 0 0 0 0 Retained Earnings millions 3,812 1,901 913 397 Other Comprehensive Income millions( 920)( 290)( 464)( 515) Total Stockholders' Equity millions 4,351 3,071 1,827 1,531Total Liabilities & Equity millions 25,196 17,612 13,736 10,101 Property, Plant and Equipment millions 993 807
MercadoLibre, Inc.Income Statements 2024 2023 2022 2021 2020
──────────────────────────────────────────────────────────────────────────────────────────────────────────────────────────
Cost of Sales millions( 11,200)( 7,517)( 5,582)( 4,064)( 2,265) Research & Development millions 1,934 1,831 1,099 590 353 Total Operating Expenses millions( 6,946)( 5,383)( 4,129)( 2,564)( 1,581)Operating Income millions 2,631 2,207 1,069 441 128Pre-tax Income millions 2,432 1,553 780 241 81Income Tax millions( 521)( 569)( 298)( 149)( 82)Net Income millions 1,911 987 482 83( 1) EPS Basic 37.69 19.64 9.57 1.67( 0.08) Shares Basic 50,697,42850,262,30250,345,35349,802,99349,740,407 EPS Diluted 37.69 19.46 9.53 1.67( 0.08) Shares Diluted 50,697,42851,006,86051,335,62149,802,99349,740,407Revenue millions 10,537 7,069 3,974
MercadoLibre, Inc.Consolidated Statement of Cash Flows 2024 2023 2022 2021 2020
──────────────────────────────────────────────────────────────────────────────────────────────────────────────────────────
Inventories millions( 113)( 69)( 114)( 142)( 107) Net Cash from Operations millions 7,918 5,140 2,940 965 1,182 Net Cash from Investing millions( 8,287)( 3,450)( 3,871)( 1,597)( 252) Stock Repurchases millions( 1)( 356)( 148)( 486)( 54) Net Cash from Financing millions 1,959( 267) 916 1,925 242Net Change in Cash millions 851 485( 285) 1,140 1,057Total Cash and Equivalents millions 4,699 3,848 3,363 3,648 2,508 Capital Expenditures millions( 509)( 454)( 573)( 247)
Statistics for MELI
Revenue
Net Income
Gross Margin %
Net Margin %
ROE %
ROA %
Loading ITables v2.3.0 from the init_notebook_mode cell...
(need help?)
Insights for MELI
ROE < 5.0%
Performance Details for MELI
44
Loading ITables v2.3.0 from the init_notebook_mode cell...
(need help?)
Maximum Drawdown for MELI
MELI
Benchmark
Loading ITables v2.3.0 from the init_notebook_mode cell...
(need help?)
GEHC
GE HealthCare Technologies Inc. (X-Ray Apparatus & Tubes & Related Irradiation Apparatus)
Fiscal year end : 1231 Report Date : 2024-12-31 Filing Date : 2025-02-13
GE HEALTHCARE TECHNOLOGIES INC.Consolidated Balance Sheets 2024 2023 2022
──────────────────────────────────────────────────────────────────────────────────────────────────
Inventory millions 1,939 1,960 2,155Total Current Assets millions 9,901 9,410 8,318Goodwill millions 13,136 12,936 12,813Other Assets millions 1,950 1,881Total Assets millions 33,089 32,454 27,539Accounts Payable millions 3,022 2,947 2,944Total Current Liabilities millions 9,553 8,981 7,191 Long-term Liabilities millions 34 33 1,603Total Liabilities millions 24,437 25,144 17,947Commitments & Contingencies Common Stock millions 5 5 0Retained Earnings millions 3,262 1,326 0Other Comprehensive Income millions( 1,379)( 691)( 1,878)Total Stockholders' Equity millions 8,446 7,133 9,357Total Liabilities & Equity millions 33,089 32,454 27,539
GE HEALTHCARE TECHNOLOGIES INC.Income Statements 2024 2023 2022 2021
──────────────────────────────────────────────────────────────────────────────────────────────────────────────
Revenue millions 19,672 19,552 18,341 6,420Selling, General & Admin millions 4,269 4,282 3,631 3,563Research & Development millions 1,311 1,205 1,026 816Total Operating Expenses millions( 5,580)( 5,487)( 4,657)( 4,379)Operating Income millions 2,625 2,435 2,522 2,795Pre-tax Income millions 2,581 2,361 2,512 2,875Income Tax millions 531 743 563 600Net Income millions 1,993 1,568 1,916 2,247 EPS Basic 4.37 3.05 4.22 4.95 EPS Diluted 4.34 3.03 4.22 4.95 Shares Basic millions 456 455 454 454 Shares Diluted millions 459 458 454 454
GE HEALTHCARE TECHNOLOGIES INC.Consolidated Statement of Cash Flows 2024 2023 2022 2021
──────────────────────────────────────────────────────────────────────────────────────────────────────────────
Stock-based Compensation millions 125 114 67 76 Inventories millions( 81)( 111)( 402)( 435) Net Cash from Investing millions( 914)( 558)( 398)( 1,761) Net Cash from Financing millions( 573)( 478)( 822)( 263)Net Change in Cash millions 387 1,055 890( 451)Total Cash and Equivalents millions 2,893 2,506 1,451 561Available durations for this statement:1 Month3 MonthsAnnual
Statistics for GEHC
Revenue
Net Income
Gross Margin %
Net Margin %
ROE %
ROA %
Loading ITables v2.3.0 from the init_notebook_mode cell...
(need help?)
Performance Details for GEHC
45
Loading ITables v2.3.0 from the init_notebook_mode cell...
(need help?)
Maximum Drawdown for GEHC
GEHC
Benchmark
Loading ITables v2.3.0 from the init_notebook_mode cell...
(need help?)
FTNT
Fortinet, Inc. (Computer Peripheral Equipment, NEC)
Fiscal year end : 1231 Report Date : 2024-12-31 Filing Date : 2025-02-21
FORTINET, INC.Consolidated Balance Sheets 2024 2023 2022 2021
──────────────────────────────────────────────────────────────────────────────────────────────────────
Cash & Equivalents 28,759 13,979 16,829 13,191 Accounts Receivable 14,634 14,020 12,617 8,077 Inventory 3,155 4,848 2,646 1,758 Total Current Assets 59,715 44,283 38,104 36,006 Property, Plant and Equipment 13,495 10,444 8,985 6,876 Goodwill 2,354 1,265 1,280 1,251 Other Assets 1,332 1,500 2,020 2,358 Total Assets 97,631 72,589 62,280 59,191 Accounts Payable 1,909 2,043 2,434 1,484 Total Current Liabilities 40,607 37,190 30,784 23,181 Long-term Liabilities 1,296 1,247 1,498 592 Total Liabilities 82,693 77,223 65,096 51,207 Commitments & Contingencies Common Stock 8 8 8 8 Other Comprehensive Income ( 261)( 189)( 202)( 48) Retained Earnings ( 1,171)( 18,617)( 15,464)( 4,679) Total Stockholders' Equity 14,938( 4,634)( 2,816) 7,817 Total Liabilities & Equity 97,631 72,589 62,280 59,191
CoStar Group, Inc.Consolidated Statement of Cash Flows 2024 2023 2022 2021 2020
──────────────────────────────────────────────────────────────────────────────────────────────────────────────────
Stock-based Compensation 890 850 752 637 534 Net Cash from Operations 3,926 4,895 4,787 4,697 4,861 Capital Expenditures ( 5,790)( 1,175)( 352)( 1,237) -0 Net Cash from Investing ( 9,129)( 2,386)( 691)( 3,813)( 4,642) Net Cash from Financing ( 137)( 37) 7,340( 157) 26,623Net Change in Cash ( 5,349) 2,479 11,409 712 26,852Total Cash and Equivalents 46,810 52,159 49,680 38,271 37,559Available durations for this statement:1 MonthAnnual
Statistics for CSGP
Revenue
Net Income
Gross Margin %
Net Margin %
ROE %
ROA %
Loading ITables v2.3.0 from the init_notebook_mode cell...
(need help?)
Insights for CSGP
ROE < 5.0%
Performance Details for CSGP
53
Loading ITables v2.3.0 from the init_notebook_mode cell...
(need help?)
Maximum Drawdown for CSGP
CSGP
Benchmark
Loading ITables v2.3.0 from the init_notebook_mode cell...
(need help?)
KHC
Kraft Heinz Co (Canned, Frozen & Preservd Fruit, Veg & Food Specialties)
Fiscal year end : 1227 Report Date : 2024-12-28 Filing Date : 2025-02-13
Kraft Heinz CoConsolidated Balance Sheets 2024 2023 2022 2021
──────────────────────────────────────────────────────────────────────────────────────────────────────────────
Cash & Equivalents millions 1,334 1,400 1,040 3,445 Accounts Receivable millions 2,147 2,112 2,120 1,957 Inventory millions 3,376 3,614 3,651 2,729 Total Current Assets millions 7,655 7,929 7,897 8,994 Goodwill millions 28,700 30,459 30,833 31,296 Other Assets millions 4,708 2,381 2,394 2,756 Total Assets millions 88,287 90,339 90,513 93,394 Total Current Liabilities millions 7,253 8,037 9,028 9,064 Long-term Liabilities millions 1,306 1,418 1,609 1,542 Total Liabilities millions 38,962 40,617 41,643 43,942 Commitments & Contingencies Common Stock millions 12 12 12 12 Retained Earnings millions 2,171 1,367 489( 1,682) Other Comprehensive Income millions( 2,915)( 2,604)( 2,810)( 1,824) Total Stockholders' Equity millions 49,185 49,526 48,678 49,298 Total Liabilities & Equity millions 88,287 90,339 90,513 93,394
Kraft Heinz CoIncome Statements 2024 2023 2022 2021 2020
──────────────────────────────────────────────────────────────────────────────────────────────────────────────────────────
Cost of Sales millions( 16,878)( 17,714)( 18,363)( 17,360)( 17,008)Selling, General & Admin millions( 7,285)( 4,354)( 4,488)( 5,222)( 7,049)Operating Income millions 1,683 4,572 3,634 3,460 2,128Pre-tax Income millions 856 3,633 2,966 1,708 1,030Income Tax millions( 1,890)( 787)( 598)( 684)( 669)Net Income millions 2,744 2,855 2,363 1,012 356 EPS Basic 2.27 2.33 1.93 0.83 0.29 EPS Diluted 2.26 2.31 1.91 0.82 0.29Available durations for this statement:3 MonthsAnnual
Kraft Heinz CoConsolidated Statement of Cash Flows 2024 2023 2022 2021 2020
──────────────────────────────────────────────────────────────────────────────────────────────────────────────────────────
Stock-based Compensation millions 109 141 148 197 156 Inventories millions( 6)( 106)( 1,121)( 144)( 249) Net Cash from Operations millions 4,184 3,976 2,469 5,364 4,929 Capital Expenditures millions( 1,024)( 1,013)( 916)( 905)( 596) Net Cash from Investing millions( 1,023)( 916)( 1,091) 4,038( 522) Stock Repurchases millions( 988)( 455)( 280)( 271) Net Cash from Financing millions( 3,008)( 2,678)( 3,714)( 9,344)( 3,331) Net Change in Cash millions 82 363( 2,405) 28 1,138 Total Cash and Equivalents millions 1,486 1,404 1,041 3,446 3,418Available durations for this statement:1 Month3 MonthsAnnual
Statistics for KHC
Revenue
Net Income
Gross Margin %
Net Margin %
ROE %
ROA %
Loading ITables v2.3.0 from the init_notebook_mode cell...
(need help?)
Insights for KHC
ROE < 5.0%
Performance Details for KHC
54
Loading ITables v2.3.0 from the init_notebook_mode cell...
(need help?)
Maximum Drawdown for KHC
KHC
Benchmark
Loading ITables v2.3.0 from the init_notebook_mode cell...
(need help?)
PEP
PEPSICO INC (Beverages)
Fiscal year end : 1227 Report Date : 2024-12-28 Filing Date : 2025-02-04
PepsiCo, Inc.Consolidated Balance Sheets 2024 2023 2022 2021
──────────────────────────────────────────────────────────────────────────────────────────────────────────────
Cash & Equivalents millions 8,505 9,711 4,954 5,596 Inventory millions 5,306 5,334 5,222 4,347 Total Current Assets millions 25,826 26,950 21,539 21,783 Property, Plant and Equipment millions 28,008 27,039 24,291 22,407 Goodwill millions 17,534 17,728 18,202 18,381 Other Assets millions 6,951 6,661 5,292 4,481 Total Assets millions 99,467 100,495 92,187 92,377 Total Current Liabilities millions 31,536 31,647 26,785 26,220 Long-term Liabilities millions 9,052 8,721 8,339 9,154 Total Liabilities millions 81,296 81,858 74,914 76,226 Commitments & Contingencies Common Stock millions 23 23 23 23 Retained Earnings millions 72,266 70,035 67,800 65,165 Other Comprehensive Income millions( 17,612)( 15,534)( 15,302)( 14,898) Total Stockholders' Equity millions 18,041 18,503 17,149 16,043Total Liabilities & Equity millions 99,467 100,495 92,187 92,377
PepsiCo, Inc.Income Statements 2024 2023 2022 2021 2020
──────────────────────────────────────────────────────────────────────────────────────────────────────────────────────────
Cost of Sales millions( 41,744)( 41,881)( 40,576)( 37,075)( 31,797)Selling, General & Admin millions( 37,190)( 36,677)( 34,459)( 31,237)( 28,453)Operating Income millions 12,887 11,986 11,512 11,162 10,080Pre-tax Income millions 11,946 11,417 10,705 9,821 9,069Income Tax millions( 2,320)( 2,262)( 1,727)( 2,142)( 1,894)Net Income millions 9,578 9,074 8,910 7,618 7,120 EPS Basic 6.97 6.59 6.45 5.51 5.14 EPS Diluted 6.95 6.56 6.42 5.49 5.12 Shares Basic millions 1,373 1,376 1,380 1,382 1,385 Shares Diluted millions 1,378 1,383 1,387 1,389 1,392
PepsiCo, Inc.Consolidated Statement of Cash Flows 2024 2023 2022 2021 2020
──────────────────────────────────────────────────────────────────────────────────────────────────────────────────────────
Stock-based Compensation millions 362 380 343 301 264 Inventories millions( 314)( 261)( 1,142)( 582)( 516) Net Cash from Operations millions 12,507 13,442 10,811 11,616 10,613 Net Cash from Investing millions( 5,472)( 5,495)( 2,430)( 3,269)( 11,619) Stock Repurchases millions( 1,000)( 1,000)( 1,500)( 106)( 2,000) Net Cash from Financing millions( 7,556)( 3,009)( 8,523)( 10,780) 3,819Net Change in Cash millions( 1,208) 4,661( 607)( 2,547) 2,684Total Cash and Equivalents millions 8,553 9,761 5,100 5,707 8,254
Statistics for PEP
Revenue
Net Income
Gross Margin %
Net Margin %
ROE %
ROA %
Loading ITables v2.3.0 from the init_notebook_mode cell...
(need help?)
Performance Details for PEP
55
Loading ITables v2.3.0 from the init_notebook_mode cell...
(need help?)
Maximum Drawdown for PEP
PEP
Benchmark
Loading ITables v2.3.0 from the init_notebook_mode cell...
(need help?)
FAST
FASTENAL CO (Retail-Building Materials, Hardware, Garden Supply)
Fiscal year end : 1231 Report Date : 2024-12-31 Filing Date : 2025-02-06
FASTENAL COConsolidated Balance Sheets 2024 2023 2022 2021
──────────────────────────────────────────────────────────────────────────────────────────────────────
Cash & Equivalents 2,558 2,213 2,301 2,362 Accounts Receivable 11,086 10,876 10,132 9,002 Inventory 16,450 15,227 17,080 15,236 Total Current Assets 32,119 30,209 31,248 28,566 Property, Plant and Equipment 10,566 10,111 10,100 10,192 Other Assets 1,503 1,607 1,708 1,809 Total Assets 46,980 44,629 45,486 42,990 Accounts Payable 2,877 2,641 2,550 2,331 Total Current Liabilities 6,871 6,613 7,898 6,822 Long-term Liabilities 141 10 35 0 Commitments & Contingencies Common Stock 57 57 57 58 Retained Earnings 36,135 33,569 32,187 29,709 Other Comprehensive Income ( 915)( 548)( 648)( 307) Total Stockholders' Equity 36,163 33,488 31,632 30,422Total Liabilities & Equity 46,980 44,629 45,486 42,990
FASTENAL COConsolidated Statement of Cash Flows 2024 2023 2022 2021 2020
──────────────────────────────────────────────────────────────────────────────────────────────────────────────────
Stock-based Compensation 80 73 72 56 57 Inventories ( 1,339)( 1,891)( 1,980)( 1,895)( 360) Net Cash from Operations 11,733 14,327 9,410 7,701 11,018 Capital Expenditures ( 2,265)( 1,728)( 1,738)( 1,566)( 1,681) Net Cash from Investing ( 2,145)( 1,612)( 1,630)( 1,485)( 2,817) Stock Repurchases -0 -0( 2,378) -0( 520) Net Cash from Financing ( 9,137)( 12,817)( 7,749)( 6,271)( 7,544)Net Change in Cash 345( 88)( 61)( 95) 708Total Cash and Equivalents 2,558 2,213 2,301 2,362 2,457
Statistics for FAST
Revenue
Net Income
Gross Margin %
Net Margin %
ROE %
ROA %
Loading ITables v2.3.0 from the init_notebook_mode cell...
(need help?)
Performance Details for FAST
56
Loading ITables v2.3.0 from the init_notebook_mode cell...
(need help?)
Maximum Drawdown for FAST
FAST
Benchmark
Loading ITables v2.3.0 from the init_notebook_mode cell...
(need help?)
MSFT
MICROSOFT CORP (Services-Prepackaged Software)
Fiscal year end : 0630 Report Date : 2024-06-30 Filing Date : 2024-07-30
MICROSOFT CORPORATIONConsolidated Balance Sheets 2024 2023 2022 2021
────────────────────────────────────────────────────────────────────────────────────────────────────────────
Cash & Equivalents millions 18,315 34,704 13,931 14,224 Accounts Receivable millions 56,924 48,688 44,261 38,043 Inventory millions 1,246 2,500 3,742 2,636 Total Current Assets millions 159,734 184,257 169,684 184,406 Property, Plant and Equipment millions 135,591 95,641 74,398 59,715 Goodwill millions 119,220 67,886 67,524 49,711 Other Assets millions 36,460 30,601 21,897 15,075 Total Assets millions 512,163 411,976 364,840 333,779 Accounts Payable millions 21,996 18,095 19,000 15,163 Total Current Liabilities millions 125,286 104,149 95,082 88,657 Long-term Liabilities millions 27,064 17,981 15,526 13,427 Total Liabilities millions 243,686 205,753 198,298 191,791 Commitments & Contingencies Retained Earnings millions 173,144 118,848 84,281 57,055 Other Comprehensive Income millions( 5,590)( 6,343)( 4,678) 1,822 Total Stockholders' Equity millions 268,477 206,223 166,542 141,988 Total Liabilities & Equity millions 512,163 411,976 364,840 333,779
MICROSOFT CORPORATIONIncome Statements 2024 2023 2022 2021 2020
──────────────────────────────────────────────────────────────────────────────────────────────────────────────────────────
Revenue millions 180,349 147,216 125,538 97,014 143,015 Cost of Sales millions( 58,842)( 48,059)( 43,586)( 18,219)( 46,078)Research & Development millions( 29,510)( 27,195)( 24,512)( 20,716)( 19,269)Operating Income millions 109,433 88,523 83,383 69,916 52,959Pre-tax Income millions 107,787 89,311 83,716 71,102 53,036Income Tax millions( 19,651)( 16,950)( 10,978)( 9,831)( 8,755)Net Income millions 88,136 72,361 72,738 61,271 44,281 EPS Basic 11.86 9.72 9.7 8.12 5.82 EPS Diluted 11.8 9.68 9.65 8.05 5.76 Shares Basic millions 7,431 7,446 7,496 7,547 7,610 Shares Diluted millions 7,469 7,472 7,540 7,608 7,683Available durations for this statement:3 MonthsAnnual
MICROSOFT CORPORATIONConsolidated Statement of Cash Flows 2024 2023 2022 2021 2020
──────────────────────────────────────────────────────────────────────────────────────────────────────────────────────────
Stock-based Compensation millions 10,734 9,611 7,502 6,118 5,289 Inventories millions( 1,284)( 1,242)( 1,123)( 737)( 168) Net Cash from Operations millions 118,548 87,582 89,035 76,740 60,675 Stock Repurchases millions( 17,254)( 22,245)( 32,696)( 27,385)( 22,968) Net Cash from Financing millions( 37,757)( 43,935)( 58,876)( 48,486)( 46,031) Capital Expenditures millions( 44,477)( 28,107)( 23,886)( 20,622)( 15,441) Net Cash from Investing millions( 96,970)( 22,680)( 30,311)( 27,577)( 12,223)Net Change in Cash millions( 16,389) 20,773( 293) 648 2,220Total Cash and Equivalents millions 18,315 34,704 13,931 14,224 13,576
Statistics for MSFT
Revenue
Net Income
Gross Margin %
Net Margin %
ROE %
ROA %
Loading ITables v2.3.0 from the init_notebook_mode cell...
(need help?)
Performance Details for MSFT
57
Loading ITables v2.3.0 from the init_notebook_mode cell...
(need help?)
Maximum Drawdown for MSFT
MSFT
Benchmark
Loading ITables v2.3.0 from the init_notebook_mode cell...
(need help?)
LRCX
LAM RESEARCH CORP (Special Industry Machinery, NEC)
Fiscal year end : 0629 Report Date : 2024-06-30 Filing Date : 2024-08-29
LAM RESEARCH CORPORATIONConsolidated Balance Sheets 2024 2023 2022 2021
───────────────────────────────────────────────────────────────────────────────────────────────────────────────
Cash & Equivalents thousands 5,847,856 5,337,056 3,522,001 4,418,263 Accounts Receivable thousands 2,519,250 2,823,376 4,313,818 3,026,430 Inventory thousands 4,217,924 4,816,190 3,966,294 2,689,294 Total Current Assets thousands12,883,22013,228,41212,285,23511,652,387 Goodwill 16 16 15 15 Other Assets thousands 1,941,917 1,905,616 1,394,313 1,061,300 Total Assets thousands18,744,72818,781,64317,195,63215,892,152 Accounts Payable thousands 613,966 470,702 1,011,208 829,710 Total Current Liabilities thousands 4,338,438 4,184,918 4,564,759 3,527,867 Long-term Liabilities thousands 575,012 501,286 422,941 398,727 Total Liabilities thousands10,205,27410,571,47110,917,266 9,864,964 Commitments & Contingencies Common Stock thousands 130 133 137 143 Other Comprehensive Income thousands( 130,428)( 100,706)( 109,982)( 64,128) Retained Earnings thousands24,811,31522,032,09618,454,72414,684,912 Total Stockholders' Equity thousands 8,539,454 8,210,172 6,278,366 6,027,188 Total Liabilities & Equity thousands18,744,72818,781,64317,195,63215,892,152
CROWDSTRIKE HOLDINGS, INC.Consolidated Statement of Cash Flows 2025 2024 2023 2022 2021
───────────────────────────────────────────────────────────────────────────────────────────────────────────────────────────
Stock-based Compensation thousands 865,421 631,519 526,504 309,952 149,675 Net Cash from Operations thousands 1,381,727 1,166,207 941,007 574,784 356,566 Capital Expenditures thousands( 254,852)( 176,529)( 235,019)( 112,143)( 52,799) Net Cash from Investing thousands( 536,588)( 340,650)( 556,658)( 564,516) 495,427 Net Cash from Financing thousands 107,208 93,158 77,437 72,531 800,135Net Change in Cash thousands 947,069 920,673 460,291 78,025 1,653,810Total Cash and Equivalents thousands 4,324,666 3,377,597 2,456,924 1,996,633 1,918,608
Statistics for CRWD
Revenue
Net Income
Gross Margin %
Net Margin %
ROE %
ROA %
Loading ITables v2.3.0 from the init_notebook_mode cell...
(need help?)
Insights for CRWD
ROE < 5.0%
Performance Details for CRWD
62
Loading ITables v2.3.0 from the init_notebook_mode cell...
(need help?)
Maximum Drawdown for CRWD
CRWD
Benchmark
Loading ITables v2.3.0 from the init_notebook_mode cell...
(need help?)
EXC
EXELON CORP (Electric & Other Services Combined)
Fiscal year end : 1231 Report Date : 2024-12-31 Filing Date : 2025-02-12
NoneConsolidated Balance Sheets 2024 2023 2022 2021
──────────────────────────────────────────────────────────────────────────────────────────────────────────────
Cash & Equivalents millions 357 445 407 34 Accounts Receivable millions 2,738 2,342 2,217 Inventory millions 43 36 Total Current Assets millions 8,384 8,087 7,336 13,957 Property, Plant and Equipment millions 78,182 73,593 69,076 11,117 Goodwill millions 6,630 6,630 6,630 Other Assets millions 1,562 1,365 1,141 59 Total Assets millions 107,784 101,856 95,349 36,470 Accounts Payable millions 3,382 2,379 Total Current Liabilities millions 9,611 9,901 10,611 1,124 Long-term Liabilities millions 2,282 2,088 1,967 Total Liabilities millions 80,863 76,101 70,605 8,712 Commitments & Contingencies Common Stock millions 21,338 21,114 20,908 Retained Earnings millions 6,426 5,490 4,597 16,942 Other Comprehensive Income millions( 720)( 726)( 638)( 2,750) Total Stockholders' Equity millions 26,921 25,755 24,744 1,575 Total Liabilities & Equity millions 107,784 101,856 95,349
NoneIncome Statements 2024 2023 2022 2021 2020
──────────────────────────────────────────────────────────────────────────────────────────────────────────────────────────
Operating Income millions 4,319 4,023 3,315 2,682 359Pre-tax Income millions 2,667 2,702 2,403 1,654 71Income Tax millions( 207)( 374)( 349)( 38)( 7) Shares Basic millions 1,003 996 986 979 976 Shares Diluted millions 1,003 997 987 980 977 Revenue
NoneConsolidated Statement of Cash Flows 2024 2023 2022 2021 2020
──────────────────────────────────────────────────────────────────────────────────────────────────────────────────────────
Inventories millions( 56)( 45)( 121)( 141)( 3) Net Cash from Operations millions 5,569 4,703 4,870 3,012 4,235 Capital Expenditures millions( 7,097)( 7,408)( 7,147)( 7,981)( 8,048) Net Cash from Investing millions( 7,042)( 7,375)( 6,990)( 3,317)( 4,336) Net Cash from Financing millions 1,311 2,683 1,591 758 198Total Cash and Equivalents millions 939 1,101 1,090 1,619 1,166Available durations for this statement:1 Month3 MonthsAnnual
Statistics for EXC
Revenue
Net Income
Gross Margin %
Net Margin %
ROE %
ROA %
Loading ITables v2.3.0 from the init_notebook_mode cell...
(need help?)
Performance Details for EXC
63
Loading ITables v2.3.0 from the init_notebook_mode cell...
(need help?)
Maximum Drawdown for EXC
EXC
Benchmark
Loading ITables v2.3.0 from the init_notebook_mode cell...
(need help?)
CSX
CSX CORP (Railroads, Line-Haul Operating)
Fiscal year end : 1231 Report Date : 2024-12-31 Filing Date : 2025-02-27
CSX CORPORATIONConsolidated Balance Sheets 2024 2023 2022 2021
──────────────────────────────────────────────────────────────────────────────────────────────────────────────
Accounts Receivable millions 1,326 1,393 1,313 1,148 Total Current Assets millions 3,447 3,339 3,807 3,873 Property, Plant and Equipment millions 34,825 34,099 34,070 33,015 Other Assets millions 759 516 506 592 Total Assets millions 42,482 41,256 41,682 40,531 Accounts Payable millions 1,290 1,237 1,130 963 Total Current Liabilities millions 3,023 2,331 2,446 2,233 Long-term Liabilities millions 560 543 571 502 Total Liabilities millions 30,041 29,101 29,213 27,031 Common Stock millions 1,900 1,959 2,066 2,202 Retained Earnings millions 10,011 9,935 10,229 11,630 Other Comprehensive Income millions( 273)( 408)( 410)( 408) Total Liabilities & Equity millions 42,482 41,256 41,682 40,531 Cash & Equivalents millions 1,958 2,239
CSX CORPORATIONIncome Statements 2024 2023 2022 2021 2020
──────────────────────────────────────────────────────────────────────────────────────────────────────────────────────────
Revenue millions 14,500 14,657 14,853 12,522 10,583Operating Income millions 5,245 5,499 5,954 5,594 4,362Pre-tax Income millions 4,600 4,800 5,300 5,000 3,600Income Tax millions( 1,085)( 1,161)( 1,231)( 1,170)( 862)Net Income millions 3,470 3,668 4,114 3,781 2,765 EPS Basic 1.79 1.83 1.93 1.68 1.2 EPS Diluted 1.79 1.82 1.92 1.68 1.2 Shares Basic millions 1,939 2,008 2,136 2,250 2,300 Shares Diluted millions 1,943 2,013 2,141 2,255 2,305Available durations for this statement:1 Years 9 Months3 Months6 Months9 Months Annual
CSX CORPORATIONConsolidated Statement of Cash Flows 2024 2023 2022 2021 2020
──────────────────────────────────────────────────────────────────────────────────────────────────────────────────────────
Net Cash from Operations millions 5,247 5,514 5,526 5,099 4,263 Capital Expenditures millions( 2,529)( 2,257)( 2,113)( 1,791)( 1,626) Net Cash from Investing millions( 2,605)( 2,227)( 2,063)( 1,877)( 649) Stock Repurchases millions( 2,237)( 3,482)( 4,731)( 2,886)( 867) Net Cash from Financing millions( 3,062)( 3,867)( 3,769)( 4,112)( 1,443)Net Change in Cash millions( 420)( 580)( 306)( 890) 2,171 Total Cash and Equivalents millions 933 1,360 1,933 2,239 3,129Available durations for this statement:1 Month 1 Years 9 Months3 Months6 Months9 Months Annual
Statistics for CSX
Revenue
Net Income
Gross Margin %
Net Margin %
ROE %
ROA %
Loading ITables v2.3.0 from the init_notebook_mode cell...
(need help?)
Performance Details for CSX
64
Loading ITables v2.3.0 from the init_notebook_mode cell...
(need help?)
Maximum Drawdown for CSX
CSX
Benchmark
Loading ITables v2.3.0 from the init_notebook_mode cell...
(need help?)
AZN
Performance Details for AZN
65
Loading ITables v2.3.0 from the init_notebook_mode cell...
(need help?)
Maximum Drawdown for AZN
AZN
Benchmark
Loading ITables v2.3.0 from the init_notebook_mode cell...
(need help?)
ADBE
ADOBE INC. (Services-Prepackaged Software)
Fiscal year end : 1129 Report Date : 2024-11-29 Filing Date : 2025-01-13
ADOBE INC.Consolidated Balance Sheets 2024 2023 2022 2021
──────────────────────────────────────────────────────────────────────────────────────────────────────────────
Cash & Equivalents millions 7,613 7,141 4,236 3,844 Accounts Receivable 207 222 207 188 Total Current Assets millions 11,232 11,084 8,996 8,669 Property, Plant and Equipment millions 1,936 2,030 1,908 1,673 Goodwill millions 12,788 12,805 12,787 12,668 Other Assets millions 1,554 1,223 841 883 Total Assets millions 30,230 29,779 27,165 27,241 Accounts Payable millions 361 314 379 312 Total Current Liabilities millions 10,521 8,251 8,128 6,932 Long-term Liabilities millions 446 376 293 257 Total Liabilities millions 16,125 13,261 13,114 12,444 Commitments & Contingencies Common Stock millions 0 0 0 0 Retained Earnings millions 38,470 33,346 28,319 23,905 Other Comprehensive Income millions( 201)( 285)( 293)( 137) Total Stockholders' Equity millions 14,105 16,518 14,051 14,797 Total Liabilities & Equity millions 30,230 29,779 27,165 27,241
ADOBE INC.Income Statements 2024 2023 2022 2021 2020
──────────────────────────────────────────────────────────────────────────────────────────────────────────────────────────
Total Operating Expenses millions( 12,406)( 10,405)( 9,343)( 8,118)( 6,909)Operating Income millions 6,741 6,650 6,098 5,802 4,237Pre-tax Income millions 6,931 6,799 6,008 5,705 4,176Income Tax millions( 1,371)( 1,371)( 1,252)( 883)( 1,084)Net Income millions 5,560 5,428 4,756 4,822 5,260EPS Basic 12.43 11.87 10.13 10.1 10.94Shares Basic 4,471 4,571 4,695 4,773 4,809EPS Diluted 12.36 11.82 10.1 10.02 10.83Shares Diluted 4,497 4,591 4,709 4,810 4,855
ADOBE INC.Consolidated Statement of Cash Flows 2024 2023 2022 2021 2020
──────────────────────────────────────────────────────────────────────────────────────────────────────────────────────────
Stock-based Compensation millions 1,833 1,718 1,440 1,069 909 Net Cash from Operations millions 8,056 7,302 7,838 7,230 5,727 Capital Expenditures millions( 183)( 360)( 442)( 348)( 419) Net Cash from Investing millions 149 776( 570)( 3,537)( 414) Stock Repurchases millions( 9,500)( 4,400)( 6,550)( 3,950)( 3,050) Net Cash from Financing millions( 7,724)( 5,182)( 6,825)( 4,301)( 3,488)Net Change in Cash millions 472 2,905 392( 634) 1,828Total Cash and Equivalents millions 7,613 7,141 4,236 3,844 4,478Available durations for this statement:3 MonthsAnnual
Statistics for ADBE
Revenue
Net Income
Gross Margin %
Net Margin %
ROE %
ROA %
Loading ITables v2.3.0 from the init_notebook_mode cell...
(need help?)
Performance Details for ADBE
66
Loading ITables v2.3.0 from the init_notebook_mode cell...
(need help?)
Maximum Drawdown for ADBE
ADBE
Benchmark
Loading ITables v2.3.0 from the init_notebook_mode cell...
(need help?)
ADI
ANALOG DEVICES INC (Semiconductors & Related Devices)
Fiscal year end : 1101 Report Date : 2024-11-02 Filing Date : 2024-11-26
Analog Devices, Inc.Consolidated Balance Sheets 2024 2023 2022 2021
───────────────────────────────────────────────────────────────────────────────────────────────────────────────
Cash & Equivalents thousands 1,991,342 958,061 1,470,572 1,977,964 Accounts Receivable thousands 1,336,331 1,469,734 1,800,462 1,459,056 Inventory thousands 1,447,687 1,642,214 1,399,914 1,200,610 Total Current Assets thousands 5,484,654 4,384,022 4,937,992 5,378,317 Property, Plant and Equipment thousands 3,415,550 3,219,157 2,401,304 1,979,051 Goodwill thousands26,909,77526,913,13426,913,13426,918,470 Other Assets thousands 749,082 742,936 519,626 383,938 Total Assets thousands48,228,27748,794,47850,302,35052,322,071 Accounts Payable thousands 487,457 493,041 582,160 443,434 Total Current Liabilities thousands 2,988,280 3,200,971 2,442,655 2,770,312 Long-term Liabilities thousands 544,489 581,000 515,363 555,838 Common Stock thousands 82,718 82,712 84,880 87,554 Retained Earnings thousands10,196,61210,356,798 8,721,325 7,517,316 Other Comprehensive Income thousands( 185,256)( 188,302)( 198,152)( 186,565) Total Stockholders' Equity thousands35,176,31735,565,12236,465,32337,992,542 Total Liabilities & Equity thousands48,228,27748,794,47850,302,35052,322,071 Commitments & Contingencies
Analog Devices, Inc.Income Statements 2024 2023 2022 2021 2020
────────────────────────────────────────────────────────────────────────────────────────────────────────────────────────────────
Revenue thousands 9,427,157 12,305,539 12,013,953 7,318,286 5,603,056 Cost of Sales thousands(4,045,814)(4,428,321)(4,481,479)(2,793,274)(1,912,578) Research & Development thousands 1,487,863 1,660,194 1,700,518 1,296,126 1,050,519 Selling, General & Admin thousands 1,068,640 1,273,584 1,266,175 915,418 659,923 Total Operating Expenses thousands(3,348,545)(4,054,106)(4,253,774)(2,832,811)(2,192,234)Operating Income thousands 2,032,798 3,823,112 3,278,700 1,692,201 1,498,244 Pre-tax Income thousands 1,777,340 3,608,003 3,098,749 1,328,714 1,311,617 Income Tax thousands ( 142,067) ( 293,424) ( 350,188) ( 61,708) ( 90,856) Net Income thousands 1,635,273 3,314,579 2,748,561 1,390,422 1,220,761Shares Basic thousands 496,166 502,232 519,226 397,462 368,633Shares Diluted thousands 498,697 505,959 523,178 401,288 371,973EPS Basic 3.3 6.6 5.29 3.5 3.31EPS Diluted 3.28 6.55 5.25 3.46 3.28
Analog Devices, Inc.Consolidated Statement of Cash Flows 2024 2023 2022 2021 2020
────────────────────────────────────────────────────────────────────────────────────────────────────────────────────────────────
Stock-based Compensation thousands 262,710 299,823 323,487 243,611 149,518 Inventories thousands ( 191,170) ( 242,299) ( 470,725) ( 65,114) ( 1,760) Net Cash from Operations thousands 3,852,529 4,817,634 4,475,402 2,735,069 2,008,487 Capital Expenditures thousands ( 730,463)(1,261,463) ( 699,308) ( 343,676) ( 165,692) Net Cash from Investing thousands(1,104,858)(1,266,385) ( 657,368) 2,143,525 ( 180,523) Stock Repurchases thousands ( 615,590)(2,963,955)(2,577,015)(2,605,144) ( 244,487) Net Cash from Financing thousands(1,714,390)(4,063,760)(4,290,720)(3,959,664)(1,420,608)Net Change in Cash thousands 1,033,281 ( 512,511) ( 507,392) 922,104 407,538Total Cash and Equivalents thousands 1,991,342 958,061 1,470,572 1,977,964 1,055,860
Statistics for ADI
Revenue
Net Income
Gross Margin %
Net Margin %
ROE %
ROA %
Loading ITables v2.3.0 from the init_notebook_mode cell...
(need help?)
Performance Details for ADI
67
Loading ITables v2.3.0 from the init_notebook_mode cell...
(need help?)
Maximum Drawdown for ADI
ADI
Benchmark
Loading ITables v2.3.0 from the init_notebook_mode cell...
(need help?)
TTD
Trade Desk, Inc. (Services-Computer Programming, Data Processing, Etc.)
Fiscal year end : 1231 Report Date : 2024-12-31 Filing Date : 2025-02-21
TRADE DESK, INC.Consolidated Balance Sheets 2024 2023 2022 2021
───────────────────────────────────────────────────────────────────────────────────────────────────────────
Cash & Equivalents thousands1,369,463 895,1291,030,506 754,154 Accounts Receivable thousands3,330,3432,870,3132,347,1952,020,720 Total Current Assets thousands5,336,4584,313,9543,845,6173,091,649 Property, Plant and Equipment thousands 209,332 161,422 173,759 135,856 Other Assets thousands 72,186 60,730 46,879 47,500 Total Assets thousands6,111,9514,888,6874,380,6793,577,340 Accounts Payable thousands2,631,2132,317,3181,871,4191,655,684 Total Current Liabilities thousands2,873,4652,510,8382,029,3231,803,305 Long-term Liabilities thousands 41,618 33,261 27,490 8,280 Total Liabilities thousands3,162,8062,724,4682,265,3402,050,034 Commitments & Contingencies thousands 0 0 0 0 Common Stock thousands 0 0 0 0 Retained Earnings thousands 354,249 196,954 665,514 612,129 Total Stockholders' Equity thousands2,949,1452,164,2192,115,3391,527,306 Total Liabilities & Equity thousands6,111,9514,888,6874,380,6793,577,340
Loading ITables v2.3.0 from the init_notebook_mode cell...
(need help?)
Maximum Drawdown for ZS
ZS
Benchmark
Loading ITables v2.3.0 from the init_notebook_mode cell...
(need help?)
ROP
ROPER TECHNOLOGIES INC (Industrial Instruments For Measurement, Display, and Control)
Fiscal year end : 1231 Report Date : 2024-12-31 Filing Date : 2025-02-24
ROPER TECHNOLOGIES, INC.Consolidated Balance Sheets 2024 2023 2022 2021
──────────────────────────────────────────────────────────────────────────────────────────────────────
Cash & Equivalents 1,882 2,143 7,928 3,515 Accounts Receivable 8,851 8,299 7,245 6,876 Inventory 1,208 1,186 1,113 692 Total Current Assets 15,427 14,814 19,324 24,211 Property, Plant and Equipment 1,497 1,196 853 827 Goodwill 193,129 171,188 159,461 1,388 Other Assets 4,434 4,077 3,954 3,698 Total Assets 313,347 281,675 269,808 237,139 Total Current Liabilities 38,322 29,632 28,925 31,218 Long-term Liabilities 4,244 4,158 4,112 3,901 Total Liabilities 124,671 107,227 109,430 121,501 Commitments & Contingencies Common Stock 11 11 11 11 Retained Earnings 160,349 148,163 137,307 94,556 Other Comprehensive Income ( 1,665)( 1,228)( 1,870)( 1,831) Total Stockholders' Equity 188,676 174,448 160,378 115,638 Total Liabilities & Equity 313,347 281,675 269,808 237,139
Ross Stores, Inc.Consolidated Statement of Cash Flows 2025 2024 2023 2022 2021
───────────────────────────────────────────────────────────────────────────────────────────────────────────────────────────────
Stock-based Compensation thousands 156,298 145,490 121,936 134,217 101,568 Inventories thousands ( 252,293) ( 168,725) ( 238,778) ( 753,291)( 323,357) Net Cash from Operations thousands 2,356,988 2,514,490 1,689,373 1,738,849 2,245,933 Capital Expenditures thousands ( 720,104) ( 762,812) ( 654,070) ( 557,840)( 405,433) Net Cash from Investing thousands ( 637,462) ( 762,812) ( 654,070) ( 557,840)( 405,433) Stock Repurchases thousands(1,049,979) ( 949,996) ( 949,996) ( 649,997)( 132,467) Net Cash from Financing thousands(1,858,505)(1,428,478)(1,405,444)(1,152,396) 1,701,859Net Change in Cash thousands ( 138,979) 323,200 ( 370,141) 28,613 3,542,359 Total Cash and Equivalents thousands 4,796,462 4,935,441 4,612,241 4,982,382 4,953,769Available durations for this statement:1 Month4 Years 11 MonthsAnnual
Statistics for ROST
Revenue
Net Income
Gross Margin %
Net Margin %
ROE %
ROA %
Loading ITables v2.3.0 from the init_notebook_mode cell...
(need help?)
Performance Details for ROST
71
Loading ITables v2.3.0 from the init_notebook_mode cell...
(need help?)
Maximum Drawdown for ROST
ROST
Benchmark
Loading ITables v2.3.0 from the init_notebook_mode cell...
(need help?)
VRSK
Verisk Analytics, Inc. (Services-Computer Processing & Data Preparation)
Fiscal year end : 1231 Report Date : 2024-12-31 Filing Date : 2025-02-26
Verisk Analytics, Inc.Consolidated Balance Sheets 2024 2023 2022 2021
──────────────────────────────────────────────────────────────────────────────────────────────────
Cash & Equivalents 2,912 3,027 1,125 1,119 Accounts Receivable 4,344 3,342 2,901 2,999 Total Current Assets 9,116 8,101 9,251 9,074 Goodwill 17,266 17,608 16,760 20,476 Other Assets 4,379 4,961 3,714 4,094 Total Assets 42,647 43,661 69,611 78,081 Total Current Liabilities 12,389 7,714 23,192 18,480 Long-term Liabilities 236 146 179 433 Total Liabilities 41,597 40,439 51,934 49,656 Commitments & Contingencies Common Stock 1 1 1 1 Retained Earnings 71,534 64,169 59,991 52,404 Other Comprehensive Income 150 582( 7,312)( 3,946) Total Stockholders' Equity 10 31 175 282 Total Liabilities & Equity 42,647 43,661 69,611 78,081 Property, Plant and Equipment 6,049 5,415 5,314
Verisk Analytics, Inc.Income Statements 2024 2023 2022 2021 2020
───────────────────────────────────────────────────────────────────────────────────────────────────────────────────────────────
Revenue millions 2,882 2,681 2,497 2,462 2,269 Selling, General & Admin 4,087 3,918 3,815 3,132 3,082 Operating Income 12,539 11,317 14,065 9,114 9,563 Pre-tax Income 12,286 10,272 12,624 7,865 8,184 Income Tax ( 2,779) ( 2,588) ( 2,203) ( 1,794) ( 1,646) Net Income 9,582 6,146 9,539 6,662 7,127 EPS Basic 6.74 4.19 6.04 4.12 4.38 EPS Diluted 6.71 4.17 6.0 4.08 4.31 Shares Basic 142154655.0146623989.0157905718.0161841441.0162610586.0 Shares Diluted 142842261.0147336159.0158928942.0163338909.0165320709.0Available durations for this statement:1 MonthAnnual
Verisk Analytics, Inc.Consolidated Statement of Cash Flows 2024 2023 2022 2021 2020
──────────────────────────────────────────────────────────────────────────────────────────────────────────────────────────
Stock-based Compensation 479 540 565 557 476 Net Cash from Operations millions 1,144 1,061 1,059 1,156 1,068 Capital Expenditures ( 2,239)( 2,300)( 2,747)( 2,684)( 2,468) Net Cash from Investing ( 1,248) 27,465 3,014( 5,920)( 5,958) Stock Repurchases ( 10,050)( 27,623)( 16,625)( 4,750)( 3,488) Net Cash from Financing ( 10,285)( 37,865)( 13,302)( 4,989)( 4,452)Net Change in Cash ( 115) 100 124 615 2,803Total Cash and Equivalents 2,912 3,027 2,927 2,803 2,803Available durations for this statement:1 MonthAnnual
Statistics for VRSK
Revenue
Net Income
Gross Margin %
Net Margin %
ROE %
ROA %
Loading ITables v2.3.0 from the init_notebook_mode cell...
(need help?)
Performance Details for VRSK
72
Loading ITables v2.3.0 from the init_notebook_mode cell...
(need help?)
Maximum Drawdown for VRSK
VRSK
Benchmark
Loading ITables v2.3.0 from the init_notebook_mode cell...
(need help?)
CCEP
Performance Details for CCEP
73
Loading ITables v2.3.0 from the init_notebook_mode cell...
(need help?)
Maximum Drawdown for CCEP
CCEP
Benchmark
Loading ITables v2.3.0 from the init_notebook_mode cell...
(need help?)
CEG
Constellation Energy Corp (Electric Services)
Fiscal year end : 1231 Report Date : 2024-12-31 Filing Date : 2025-02-18
NoneConsolidated Balance Sheets 2024 2023 2022 2021
──────────────────────────────────────────────────────────────────────────────────────────────────────────────
Cash & Equivalents millions 59 48 51 504 Accounts Receivable millions 3,116 1,934 2,585 1,669 Total Current Assets millions 10,776 8,299 9,360 532 Property, Plant and Equipment millions 21,235 22,116 19,822 19,612 Goodwill millions 420 425 47 Other Assets millions 2,178 1,910 2,059 1,717 Total Assets millions 52,893 50,738 46,909 48,086 Total Current Liabilities millions 6,846 6,319 7,839 102 Long-term Liabilities millions 2 2 1,178 3 Total Liabilities millions 39,387 39,472 35,537 36,472 Commitments & Contingencies Retained Earnings millions 4,066 761( 496) 0 Other Comprehensive Income millions( 2,302)( 2,191)( 1,760)( 31) Total Liabilities & Equity millions 52,893 50,738 46,909 48,086 Accounts Payable millions 17 10
NoneIncome Statements 2024 2023 2022 2021 2020
──────────────────────────────────────────────────────────────────────────────────────────────────────────────────────────
Operating Income millions 4,352 1,610 495( 346) 256Income Tax millions( 774)( 859)( 388)( 225)( 249)Net Income millions 3,749 1,623( 160)( 205) 589 Shares Basic millions 315 323 328 0 0 Shares Diluted millions 315 324 329 0 0 EPS Basic 11.91 5.02( 0.49) 0 0 EPS Diluted 11.89 5.01( 0.49) 0 0Available durations for this statement:1 MonthAnnual
NoneConsolidated Statement of Cash Flows 2024 2023 2022 2021 2020
──────────────────────────────────────────────────────────────────────────────────────────────────────────────────────────
Inventories millions( 99)( 60)( 228)( 68)( 77) Net Cash from Operations millions( 2,470)( 5,388)( 2,440)( 1,338) 584 Capital Expenditures millions( 2,565)( 2,422)( 1,689)( 1,329)( 1,747) Net Cash from Investing millions 7,428 3,031 3,104 3,282 1,958 Net Cash from Financing millions( 2,283) 2,296( 739)( 1,695)( 2,664)Total Cash and Equivalents millions 3,129 454 528 576 327Available durations for this statement:1 MonthAnnual
Statistics for CEG
Revenue
Net Income
Gross Margin %
Net Margin %
ROE %
ROA %
Loading ITables v2.3.0 from the init_notebook_mode cell...
(need help?)
Insights for CEG
Net margin below 0.0% (negative)
Net Debt/EBITDA above 3.5 (heavy leverage).
Interest coverage below 2.0 => potential default risk.
Performance Details for CEG
74
Loading ITables v2.3.0 from the init_notebook_mode cell...
(need help?)
Maximum Drawdown for CEG
CEG
Benchmark
Loading ITables v2.3.0 from the init_notebook_mode cell...
(need help?)
CPRT
COPART INC (Retail-Auto Dealers & Gasoline Stations)
Fiscal year end : 0731 Report Date : 2024-07-31 Filing Date : 2024-09-30
COPART, INC.Consolidated Balance Sheets 2024 2023 2022 2021
───────────────────────────────────────────────────────────────────────────────────────────────────────────────
Accounts Receivable thousands 785,877 702,038 578,573 480,628 Inventory thousands 43,639 39,973 58,791 44,968 Total Current Assets thousands 4,418,184 3,262,604 2,202,455 1,702,611 Property, Plant and Equipment thousands 3,175,838 2,844,339 2,485,764 2,296,624 Goodwill thousands 513,909 394,289 401,954 355,717 Other Assets thousands 129,444 65,806 47,708 41,831 Total Assets thousands 8,427,764 6,737,879 5,308,864 4,562,143 Total Current Liabilities thousands 628,567 492,769 440,889 421,031 Total Liabilities thousands 879,209 750,439 683,265 1,032,942 Commitments & Contingencies Common Stock thousands 96 96 96 Other Comprehensive Income thousands( 142,972)( 141,006)( 169,365)( 100,860) Retained Earnings thousands 6,545,902 5,189,440 3,956,408 2,868,203 Total Liabilities & Equity thousands 8,427,764 6,737,879 5,308,864 4,562,143 Total Stockholders' Equity thousands 5,987,440 4,625,599
COPART, INC.Consolidated Statement of Cash Flows 2024 2023 2022 2021 2020
────────────────────────────────────────────────────────────────────────────────────────────────────────────────────────────
Stock-based Compensation thousands 35,234 39,673 38,965 40,922 23,322 Inventories thousands( 3,698) ( 26,549)( 10,851)( 24,602)( 1,348) Net Cash from Operations thousands 1,472,564 1,364,210 1,176,683 990,891 917,885 Capital Expenditures thousands( 510,990) ( 516,636)( 337,448)( 462,996)( 591,972) Net Cash from Investing thousands( 940,079)(1,892,049)( 442,310)( 465,466)( 601,208) Net Cash from Financing thousands 19,273 66,615( 382,693) 40,922( 27,414)Net Change in Cash thousands 556,716 ( 426,841) 335,976 570,542 291,399Total Cash and Equivalents thousands 1,514,111 957,395 1,384,236 1,048,260 477,718Available durations for this statement:1 MonthAnnual
Statistics for CPRT
Revenue
Net Income
Gross Margin %
Net Margin %
ROE %
ROA %
Loading ITables v2.3.0 from the init_notebook_mode cell...
(need help?)
Performance Details for CPRT
75
Loading ITables v2.3.0 from the init_notebook_mode cell...
(need help?)
Maximum Drawdown for CPRT
CPRT
Benchmark
Loading ITables v2.3.0 from the init_notebook_mode cell...
(need help?)
MAR
MARRIOTT INTERNATIONAL INC /MD/ (Hotels & Motels)
Fiscal year end : 1231 Report Date : 2024-12-31 Filing Date : 2025-02-11
MARRIOTT INTERNATIONAL INC /MD/Consolidated Balance Sheets 2024 2023 2022 2021
──────────────────────────────────────────────────────────────────────────────────────────────────────────────
Cash & Equivalents millions 396 338 507 1,393 Total Current Assets millions 3,485 3,311 3,313 3,626 Property, Plant and Equipment millions 1,833 1,581 1,585 1,503 Goodwill millions 8,731 8,886 8,872 9,073 Other Assets millions 716 658 584 604 Total Assets millions 26,182 25,674 24,815 25,553 Total Current Liabilities millions 8,649 7,762 7,339 6,407 Long-term Liabilities millions 1,377 1,482 1,842 2,002 Common Stock millions 5 5 5 5 Retained Earnings millions 16,531 14,838 12,342 10,305 Other Comprehensive Income millions( 1,063)( 647)( 729)( 342) Total Stockholders' Equity millions( 2,992)( 682) 568 Total Liabilities & Equity millions 26,182 25,674 24,815 25,553
MARRIOTT INTERNATIONAL INC /MD/Income Statements 2024 2023 2022 2021 2020
──────────────────────────────────────────────────────────────────────────────────────────────────────────────────────────
Operating Income millions 3,767 3,864 3,462 1,750 84Pre-tax Income millions 3,151 3,378 3,114 1,180( 466)Income Tax millions( 776)( 295)( 756)( 81)( 199)Net Income millions 2,375 3,083 2,358 1,099( 267) EPS Basic 8.36 10.23 7.27 3.36( 0.82) EPS Diluted 8.33 10.18 7.24 3.34( 0.82)
MARRIOTT INTERNATIONAL INC /MD/Consolidated Statement of Cash Flows 2024 2023 2022 2021 2020
──────────────────────────────────────────────────────────────────────────────────────────────────────────────────────────
Stock-based Compensation millions 237 205 192 182 201 Net Cash from Operations millions 2,749 3,170 2,363 1,177 1,639 Capital Expenditures millions( 750)( 452)( 332)( 183)( 135) Net Cash from Investing millions( 734)( 465)( 297)( 187) 35 Stock Repurchases millions( 3,762)( 3,953)( 2,566) -0( 150) Net Cash from Financing millions( 1,956)( 2,864)( 2,962)( 463)( 1,033)Net Change in Cash millions 59( 159)( 896) 527 641Total Cash and Equivalents millions 425 366 525 1,421 894
Statistics for MAR
Revenue
Net Income
Gross Margin %
Net Margin %
ROE %
ROA %
Loading ITables v2.3.0 from the init_notebook_mode cell...
(need help?)
Performance Details for MAR
76
Loading ITables v2.3.0 from the init_notebook_mode cell...
(need help?)
Maximum Drawdown for MAR
MAR
Benchmark
Loading ITables v2.3.0 from the init_notebook_mode cell...
(need help?)
FANG
Diamondback Energy, Inc. (Crude Petroleum & Natural Gas)
Fiscal year end : 1231 Report Date : 2024-12-31 Filing Date : 2025-02-26
Diamondback Energy, Inc.Consolidated Balance Sheets 2024 2023 2022 2021
──────────────────────────────────────────────────────────────────────────────────────────────────────────────
Cash & Equivalents millions 161 582 157 654 Accounts Receivable millions 1,387 654 618 598 Inventory millions 116 63 67 62 Total Current Assets millions 2,110 1,621 1,392 1,446 Property, Plant and Equipment millions 64,472 26,674 23,759 20,619 Other Assets millions 159 131 42 76 Total Assets millions 67,292 29,001 26,209 22,898 Total Current Liabilities millions 4,811 2,108 1,716 1,438 Long-term Liabilities millions 39 12 12 40 Total Liabilities millions 27,430 11,571 10,519 9,653 Commitments & Contingencies Retained Earnings millions 4,238 2,489 801( 1,998) Other Comprehensive Income millions( 6)( 8)( 7) 0 Total Stockholders' Equity millions 37,736 16,625 15,009 12,088 Total Liabilities & Equity millions 67,292 29,001 26,209 22,898
Diamondback Energy, Inc.Income Statements 2024 2023 2022 2021 2020
───────────────────────────────────────────────────────────────────────────────────────────────────────────────────────────
Revenue millions 111 0 0 2,756 Cost of Sales Selling, General & Admin millions 213 150 144 146 88Operating Income millions 4,396 4,570 6,508 4,001( 5,476)Pre-tax Income millions 4,501 4,248 5,736 2,907( 5,776)Income Tax millions ( 800)( 912)( 1,174)( 631)( 1,104) EPS Basic 15.53 17.34 24.61 12.24( 28.61) EPS Diluted 15.53 17.34 24.61 12.24( 28.61) Shares Basic thousands 213,545 179,999 176,539 176,643 157,976 Shares Diluted thousands 213,545 179,999 176,539 176,643 157,976Net Income millions 3,338 3,143 4,386 2,182( 4,517)Available durations for this statement:1 MonthAnnual
Diamondback Energy, Inc.Consolidated Statement of Cash Flows 2024 2023 2022 2021 2020
──────────────────────────────────────────────────────────────────────────────────────────────────────────────────────────
Stock-based Compensation millions 65 54 55 51 37 Net Cash from Operations millions 6,413 5,920 6,325 3,944 2,118 Net Cash from Investing millions( 11,221)( 3,323)( 3,330)( 1,539)( 2,101) Stock Repurchases millions( 959)( 840)( 1,098)( 431)( 98)Net Cash from Financing millions 4,387( 2,176)( 3,503)( 1,841)( 37)Net Change in Cash millions( 421) 421( 508) 564( 20)Total Cash and Equivalents millions 164 585 164 672 108Available durations for this statement:1 Month3 MonthsAnnual
Statistics for FANG
Revenue
Net Income
Gross Margin %
Net Margin %
ROE %
ROA %
Loading ITables v2.3.0 from the init_notebook_mode cell...
(need help?)
Performance Details for FANG
77
Loading ITables v2.3.0 from the init_notebook_mode cell...
(need help?)
Maximum Drawdown for FANG
FANG
Benchmark
Loading ITables v2.3.0 from the init_notebook_mode cell...
(need help?)
ORLY
O REILLY AUTOMOTIVE INC (Retail-Auto & Home Supply Stores)
Fiscal year end : 1231 Report Date : 2024-12-31 Filing Date : 2025-02-28
O Reilly Automotive IncConsolidated Balance Sheets 2024 2023 2022 2021
───────────────────────────────────────────────────────────────────────────────────────────────────────────────────
Cash & Equivalents thousands 130,245 279,132 108,583 362,113 Accounts Receivable thousands 356,839 375,049 343,155 272,562 Inventory thousands 5,095,804 4,658,367 4,359,126 3,686,383 Total Current Assets thousands 5,839,895 5,558,302 5,048,259 4,504,262 Property, Plant and Equipment thousands 5,605,156 5,036,980 4,424,041 4,213,515 Goodwill thousands 930,161 897,696 884,445 879,340 Other Assets thousands 193,891 179,463 158,967 139,112 Total Assets thousands 14,893,741 13,872,995 12,627,979 11,718,707 Accounts Payable thousands 6,524,811 6,091,700 5,881,157 4,695,312 Total Current Liabilities thousands 8,283,505 7,661,353 7,063,817 5,874,615 Long-term Liabilities thousands 231,961 203,980 201,258 206,568 Common Stock thousands 575 591 624 670 Retained Earnings thousands(2,791,288)(3,131,532)(2,375,860)(1,365,802) Other Comprehensive Income thousands ( 42,813) 39,388 2,996 ( 6,799) Total Stockholders' Equity thousands(1,370,961)(1,739,278)(1,060,752) ( 66,423) Total Liabilities & Equity thousands 14,893,741 13,872,995 12,627,979 11,718,707
O Reilly Automotive IncConsolidated Statement of Cash Flows 2024 2023 2022 2021 2020
────────────────────────────────────────────────────────────────────────────────────────────────────────────────────────────────
Stock-based Compensation thousands 28,931 27,511 26,458 24,656 22,747 Inventories thousands ( 403,886) ( 288,323) ( 669,046) ( 32,634) ( 198,864) Net Cash from Operations thousands 3,049,576 3,034,084 3,148,250 3,207,310 2,836,603 Capital Expenditures thousands(1,023,387)(1,006,264) ( 563,342) ( 442,853) ( 465,579) Net Cash from Investing thousands(1,166,805) ( 995,936) ( 739,985) ( 615,620) ( 614,895) Stock Repurchases thousands(2,076,529)(3,151,155)(3,282,265)(2,476,048)(2,087,194) Net Cash from Financing thousands(2,029,717)(1,868,738)(2,662,536)(2,694,858)(1,796,577)Net Change in Cash thousands ( 148,887) 170,549 ( 253,530) ( 103,527) 425,234Total Cash and Equivalents thousands 130,245 279,132 108,583 362,113 465,640
Statistics for ORLY
Revenue
Net Income
Gross Margin %
Net Margin %
ROE %
ROA %
Loading ITables v2.3.0 from the init_notebook_mode cell...
(need help?)
Performance Details for ORLY
78
Loading ITables v2.3.0 from the init_notebook_mode cell...
(need help?)
Maximum Drawdown for ORLY
ORLY
Benchmark
Loading ITables v2.3.0 from the init_notebook_mode cell...
(need help?)
PYPL
PayPal Holdings, Inc. (Services-Business Services, NEC)
Fiscal year end : 1231 Report Date : 2024-12-31 Filing Date : 2025-02-04
PayPal Holdings, Inc.Consolidated Balance Sheets 2024 2023 2022 2021
──────────────────────────────────────────────────────────────────────────────────────────────────────────────
Cash & Equivalents millions 6,561 9,081 7,776 5,197 Accounts Receivable millions 984 1,069 963 800 Total Current Assets millions 61,092 62,569 57,424 52,574 Goodwill millions 10,837 11,026 11,209 11,454 Other Assets millions 3,265 3,273 2,455 1,737 Total Assets millions 81,611 82,166 78,624 75,803 Accounts Payable millions 227 139 126 197 Total Current Liabilities millions 48,376 48,466 45,008 43,029 Long-term Liabilities millions 2,939 2,973 2,925 Total Liabilities millions 61,194 61,115 58,350 54,076 Commitments & Contingencies Common Stock millions 0 0 0 0 Retained Earnings millions 27,347 23,200 18,954 16,535 Other Comprehensive Income millions( 550)( 746)( 928)( 136) Total Stockholders' Equity millions 20,417 21,051 20,274 21,727 Total Liabilities & Equity millions 81,611 82,166 78,624 75,803 Property, Plant and Equipment millions 1,488 1,730 1,909
PayPal Holdings, Inc.Income Statements 2024 2023 2022 2021 2020
──────────────────────────────────────────────────────────────────────────────────────────────────────────────────────────
Total Operating Expenses millions( 26,472)( 24,743)( 23,681)( 21,109)( 18,165)Operating Income millions 5,325 5,028 3,837 4,262 3,289Income Tax millions( 1,182)( 1,165)( 947)( 70)( 863)Net Income millions 4,147 4,246 2,419 4,169 4,202 EPS Basic 4.03 3.85 2.1 3.55 3.58 EPS Diluted 3.99 3.84 2.09 3.52 3.54 Shares Basic millions 1,029 1,103 1,154 1,174 1,173 Shares Diluted millions 1,039 1,107 1,158 1,186 1,187
PayPal Holdings, Inc.Consolidated Statement of Cash Flows 2024 2023 2022 2021 2020
──────────────────────────────────────────────────────────────────────────────────────────────────────────────────────────
Stock-based Compensation millions 1,230 1,475 1,261 1,376 1,376 Net Cash from Operations millions 7,450 4,843 5,813 5,797 6,219 Capital Expenditures millions( 683)( 623)( 706)( 908)( 866) Net Cash from Investing millions 1,589 752( 3,328)( 5,149)( 16,545) Stock Repurchases millions( 6,047)( 5,000)( 4,199)( 3,400)( 1,600) Net Cash from Financing millions( 8,276)( 2,993)( 1,203)( 557) 12,454Net Change in Cash millions 556 2,678 1,127( 11) 2,297Total Cash and Equivalents millions 22,390 21,834 19,156 18,029 18,040Available durations for this statement:1 MonthAnnual
Statistics for PYPL
Revenue
Net Income
Gross Margin %
Net Margin %
ROE %
ROA %
Loading ITables v2.3.0 from the init_notebook_mode cell...
(need help?)
Insights for PYPL
ROE < 5.0%
Performance Details for PYPL
79
Loading ITables v2.3.0 from the init_notebook_mode cell...
(need help?)
Maximum Drawdown for PYPL
PYPL
Benchmark
Loading ITables v2.3.0 from the init_notebook_mode cell...
(need help?)
LULU
lululemon athletica inc. (Apparel & Other Finishd Prods of Fabrics & Similar Matl)
Fiscal year end : 0202 Report Date : 2025-02-02 Filing Date : 2025-03-27
lululemon athletica inc.Consolidated Balance Sheets 2025 2024 2023 2022
───────────────────────────────────────────────────────────────────────────────────────────────────────────────
Inventory thousands 1,442,081 1,323,602 1,447,367 966,481 Total Current Assets thousands 3,980,302 4,060,577 3,159,453 2,614,853 Property, Plant and Equipment thousands 1,780,617 1,545,811 1,269,614 927,710 Goodwill thousands 159,518 24,083 24,144 386,880 Other Assets thousands 237,841 186,684 156,045 132,102 Total Assets thousands 7,603,292 7,091,941 5,607,038 4,942,478 Accounts Payable thousands 271,406 348,441 172,732 289,728 Total Current Liabilities thousands 1,839,630 1,631,261 1,492,198 1,405,334 Long-term Liabilities thousands 40,790 29,201 20,040 13,616 Total Liabilities thousands 3,279,245 2,859,860 2,458,239 2,202,432 Commitments & Contingencies Common Stock thousands 581 606 611 616 Retained Earnings thousands 4,109,717 3,920,362 2,926,127 2,512,840 Other Comprehensive Income thousands( 424,441)( 264,256)( 252,584)( 195,917) Total Stockholders' Equity thousands 4,324,047 4,232,081 3,148,799 2,740,046 Total Liabilities & Equity thousands 7,603,292 7,091,941 5,607,038 4,942,478
MICROCHIP TECHNOLOGY INCORPORATEDConsolidated Statement of Cash Flows 2024 2023 2022 2021 2020
──────────────────────────────────────────────────────────────────────────────────────────────────────────────────
Stock-based Compensation 1,775 1,704 2,102 1,983 1,702 Inventories ( 128)( 4,832)( 1,778)( 184)( 288) Net Cash from Operations 28,927 36,210 28,427 19,165 15,438 Capital Expenditures ( 2,851)( 4,862)( 3,701)( 926)( 676) Net Cash from Investing ( 3,921)( 5,995)( 4,777)( 1,733)( 1,332) Stock Repurchases ( 9,821)( 9,458)( 4,256) -0 -0 Net Cash from Financing ( 24,149)( 31,049)( 23,276)( 18,642)( 14,382)Net Change in Cash 857( 834) 374( 1,210)( 276)Total Cash and Equivalents 3,197 2,340 3,174 2,800 4,010Available durations for this statement:1 MonthAnnual
Statistics for MCHP
Revenue
Net Income
Gross Margin %
Net Margin %
ROE %
ROA %
Loading ITables v2.3.0 from the init_notebook_mode cell...
(need help?)
Performance Details for MCHP
83
Loading ITables v2.3.0 from the init_notebook_mode cell...
(need help?)
Maximum Drawdown for MCHP
MCHP
Benchmark
Loading ITables v2.3.0 from the init_notebook_mode cell...
(need help?)
TSLA
Tesla, Inc. (Motor Vehicles & Passenger Car Bodies)
Fiscal year end : 1231 Report Date : 2024-12-31 Filing Date : 2025-01-30
Tesla, Inc.Consolidated Balance Sheets 2024 2023 2022 2021 2020
──────────────────────────────────────────────────────────────────────────────────────────────────────────────────────────
Cash & Equivalents millions 16,139 16,398 16,253 17,576 19,384 Accounts Receivable millions 4,418 3,508 2,952 1,913 Inventory millions 12,017 13,626 12,839 5,757 Total Current Assets millions 58,360 49,616 40,917 27,100 Property, Plant and Equipment millions 35,836 29,725 23,548 12,702 12,747 Goodwill millions 244 253 194 200 Other Assets millions 4,215 4,531 3,865 2,138 Total Assets millions 122,070 106,618 82,338 62,131 Accounts Payable millions 12,474 14,431 15,255 10,025 Total Current Liabilities millions 28,821 28,748 26,709 19,705 Long-term Liabilities millions 10,495 8,153 5,330 3,546 Total Liabilities millions 48,390 43,009 36,440 30,548Commitments & Contingencies Common Stock millions 3 3 3 3 Other Comprehensive Income millions( 670)( 143)( 361) 54 Retained Earnings millions 28,118 27,882 12,885( 5,188)( 5,399) Total Stockholders' Equity millions 72,913 62,634 44,704 30,189Total Liabilities & Equity millions 122,070 106,618 82,338 62,131
Tesla, Inc.Income Statements 2024 2023 2022 2021 2020
──────────────────────────────────────────────────────────────────────────────────────────────────────────────────────────
Revenue millions 77,070 82,419 71,462 2,789 2,306 Research & Development millions 4,540 3,969 3,075 2,593 1,491 Selling, General & Admin millions 5,150 4,800 3,946 4,517 3,145 Total Operating Expenses millions( 10,374)( 8,769)( 7,197)( 7,083)( 4,636)Operating Income millions 7,076 8,891 13,656 6,523 1,994Pre-tax Income millions 8,990 9,973 13,719 6,343 1,154Income Tax millions( 1,840)( 5,000)( 1,130)( 699)( 292)Net Income millions 7,091 14,997 12,556 5,519 721 EPS Basic 2.23 4.73 4.02 1.87 0.25 EPS Diluted 2.04 4.3 3.62 1.63 0.21 Shares Basic millions 3,197 3,174 3,130 2,959 2,798 Shares Diluted millions 3,498 3,485 3,475 3,386 3,249 Cost of Sales millions 5,880 3,906 2,671Available durations for this statement:3 MonthsAnnual
Tesla, Inc.Consolidated Statement of Cash Flows 2024 2023 2022 2021 2020
──────────────────────────────────────────────────────────────────────────────────────────────────────────────────────────
Stock-based Compensation millions 1,999 1,812 1,560 2,121 1,734 Inventories millions( 937)( 1,195)( 6,465)( 1,709)( 422) Net Cash from Operations millions 14,923 13,256 14,724 11,497 5,943 Capital Expenditures millions( 11,339)( 8,898)( 7,158)( 6,482)( 3,157) Net Cash from Investing millions( 18,787)( 15,584)( 11,973)( 7,868)( 3,132) Net Cash from Financing millions 3,853 2,589( 3,527)( 5,203) 9,973Net Change in Cash millions( 152) 265( 1,220)( 1,757) 13,118
Statistics for TSLA
Revenue
Net Income
Gross Margin %
Net Margin %
ROE %
ROA %
Loading ITables v2.3.0 from the init_notebook_mode cell...
(need help?)
Performance Details for TSLA
84
Loading ITables v2.3.0 from the init_notebook_mode cell...
(need help?)
Maximum Drawdown for TSLA
TSLA
Benchmark
Loading ITables v2.3.0 from the init_notebook_mode cell...
(need help?)
SBUX
STARBUCKS CORP (Retail-Eating & Drinking Places)
Fiscal year end : 0927 Report Date : 2024-09-29 Filing Date : 2024-11-20
Starbucks CorporationConsolidated Balance Sheets 2024 2023 2022 2021 2020
────────────────────────────────────────────────────────────────────────────────────────────────────────────────
Accounts Receivable 12,138 11,841 11,755 9,400 Inventory 17,773 18,064 21,766 16,039 Total Current Assets 68,474 73,034 70,187 97,564 Property, Plant and Equipment 86,655 73,871 65,605 63,695 Other Assets 6,170 5,465 5,542 5,785 Goodwill 33,157 32,183 32,835 36,773 35,972 Total Assets 313,393 294,455 279,784 313,926 293,745 Accounts Payable 15,955 15,443 14,414 12,116 Total Current Liabilities 90,700 93,453 91,518 81,514 Total Liabilities 387,809 374,333 366,771 367,071 Common Stock 11 11 11 12 Retained Earnings ( 73,438)( 72,558)( 84,498)( 63,157) Other Comprehensive Income ( 4,288)( 7,782)( 4,632) 1,472 Total Stockholders' Equity ( 74,489)( 79,948)( 87,066)( 53,212) Total Liabilities & Equity 313,393 294,455 279,784 313,926
Starbucks CorporationConsolidated Statement of Cash Flows 2024 2023 2022 2021 2020
──────────────────────────────────────────────────────────────────────────────────────────────────────────────────
Stock-based Compensation 3,083 3,027 2,715 3,191 2,486 Inventories ( 428)( 3,664)( 6,410)( 498)( 109) Net Cash from Operations 60,956 60,087 43,973 59,891 15,978 Capital Expenditures ( 27,775)( 23,336)( 18,413)( 14,700)( 14,836) Net Cash from Investing ( 26,992)( 22,708)( 21,463)( 3,195)( 17,115) Stock Repurchases ( 12,667)( 9,844)( 40,130) -0( 16,989) Net Cash from Financing ( 37,182)( 29,906)( 56,380)( 36,510) 17,133Net Change in Cash ( 2,653) 7,331( 36,373) 21,048 16,643 Total Cash and Equivalents 32,862 35,515 28,184 64,557 43,509
Statistics for SBUX
Revenue
Net Income
Gross Margin %
Net Margin %
ROE %
ROA %
Loading ITables v2.3.0 from the init_notebook_mode cell...
(need help?)
Performance Details for SBUX
85
Loading ITables v2.3.0 from the init_notebook_mode cell...
(need help?)
Maximum Drawdown for SBUX
SBUX
Benchmark
Loading ITables v2.3.0 from the init_notebook_mode cell...
(need help?)
AVGO
Broadcom Inc. (Semiconductors & Related Devices)
Fiscal year end : 1102 Report Date : 2024-11-03 Filing Date : 2024-12-20
Broadcom Inc.Consolidated Balance Sheets 2024 2023 2022 2021
──────────────────────────────────────────────────────────────────────────────────────────────────────────
Cash & Equivalents millions 9,348 14,189 12,416 12,163 Accounts Receivable millions 4,416 3,154 2,958 2,071 Inventory millions 1,760 1,898 1,925 1,297 Total Current Assets millions 19,595 20,847 18,504 16,586 Property, Plant and Equipment millions 2,521 2,154 2,223 2,348 Goodwill millions 97,873 43,653 43,614 43,450 Other Assets millions 5,073 2,340 1,797 1,812 Total Assets millions 165,645 72,861 73,249 75,570 Accounts Payable millions 1,662 1,210 998 1,086 Total Current Liabilities millions 16,697 7,405 7,052 6,281 Long-term Liabilities millions 14,975 3,847 4,413 4,860 Total Liabilities millions 97,967 48,873 50,540 50,581 Commitments & Contingencies Common Stock millions 5 4 0 0 Retained Earnings millions 0 2,682 1,604 748 Other Comprehensive Income millions 207 207( 54)( 116) Total Liabilities & Equity millions 165,645 72,861 73,249 75,570
Broadcom Inc.Income Statements 2024 2023 2022 2021 2020
──────────────────────────────────────────────────────────────────────────────────────────────────────────────────────────
Revenue millions 51,574 35,819 33,203 27,450 23,888Research & Development millions 9,310 5,253 4,919 4,854 4,968Selling, General & Admin millions 4,959 1,592 1,382 1,347 1,935Total Operating Expenses millions( 19,046)( 8,483)( 7,870)( 8,325)( 9,502)Operating Income millions 13,463 16,207 14,225 8,519 4,014Pre-tax Income millions 9,916 15,097 12,434 6,765 2,443Income Tax millions( 3,748)( 1,015)( 939)( 29)( 518)
Broadcom Inc.Consolidated Statement of Cash Flows 2024 2023 2022 2021 2020
──────────────────────────────────────────────────────────────────────────────────────────────────────────────────────────
Stock-based Compensation millions 5,741 2,171 1,533 1,704 1,976 Inventories millions( 150)( 27)( 627)( 294)( 31) Net Cash from Operations millions 19,962 18,085 16,736 13,764 12,061 Capital Expenditures millions( 548)( 452)( 424)( 443)( 463) Net Cash from Investing millions( 23,070)( 689)( 667)( 245)( 11,109) Stock Repurchases millions( 7,176)( 5,824)( 7,000) -0 -0 Net Cash from Financing millions( 1,733)( 15,623)( 15,816)( 8,974) 1,611Net Change in Cash millions( 4,841) 1,773 253 4,545 2,563Total Cash and Equivalents millions 9,348 14,189 12,416 12,163 7,618
Statistics for AVGO
Revenue
Net Income
Gross Margin %
Net Margin %
ROE %
ROA %
Loading ITables v2.3.0 from the init_notebook_mode cell...
(need help?)
Performance Details for AVGO
86
Loading ITables v2.3.0 from the init_notebook_mode cell...
(need help?)
Maximum Drawdown for AVGO
AVGO
Benchmark
Loading ITables v2.3.0 from the init_notebook_mode cell...
(need help?)
CDNS
CADENCE DESIGN SYSTEMS INC (Services-Prepackaged Software)
Fiscal year end : 1231 Report Date : 2024-12-31 Filing Date : 2025-02-21
CADENCE DESIGN SYSTEMS, INC.Consolidated Balance Sheets 2024 2023 2022
───────────────────────────────────────────────────────────────────────────────────────────────────
Cash & Equivalents thousands 2,644,030 1,008,152 882,325 Inventory thousands 257,711 181,661 128,005 Total Current Assets thousands 4,016,079 1,976,217 1,706,767 Property, Plant and Equipment thousands 458,200 403,213 371,451 Goodwill thousands 2,378,671 1,535,845 928,358 Total Assets thousands 8,974,482 5,669,491 5,137,071 Total Current Liabilities thousands 1,370,105 1,590,867 1,347,696 Long-term Liabilities thousands 339,448 275,651 304,660 Commitments & Contingencies Retained Earnings thousands 5,991,868 4,936,384 3,895,240 Other Comprehensive Income thousands( 190,448)( 94,754)( 91,637) Total Stockholders' Equity thousands 4,673,578 3,404,271 2,740,675 Total Liabilities & Equity thousands 8,974,482 5,669,491 5,137,071
CADENCE DESIGN SYSTEMS, INC.Consolidated Statement of Cash Flows 2024 2023 2022 2021
────────────────────────────────────────────────────────────────────────────────────────────────────────────────
Total Cash and Equivalents thousands 2,644,030 1,008,152 1,088,940 928,432 Stock-based Compensation thousands 391,219 325,611 270,439 197,268 Inventories thousands( 82,771)( 65,895) ( 23,073)( 25,685) Net Cash from Operations thousands 1,260,551 1,349,176 1,241,894 904,922 Capital Expenditures thousands( 142,542)( 102,337) ( 123,215)( 94,813) Net Cash from Investing thousands( 837,118)( 412,249) ( 738,634)( 292,158) Stock Repurchases thousands( 550,026)( 700,134)(1,050,091)( 380,064) Net Cash from Financing thousands 1,239,241( 803,573) ( 657,049)( 415,289)Net Change in Cash thousands 1,635,878 125,827 ( 206,615) 223,222Available durations for this statement:1 MonthAnnual
Statistics for CDNS
Revenue
Net Income
Gross Margin %
Net Margin %
ROE %
ROA %
Loading ITables v2.3.0 from the init_notebook_mode cell...
(need help?)
Performance Details for CDNS
87
Loading ITables v2.3.0 from the init_notebook_mode cell...
(need help?)
Maximum Drawdown for CDNS
CDNS
Benchmark
Loading ITables v2.3.0 from the init_notebook_mode cell...
(need help?)
TEAM
Performance Details for TEAM
88
Loading ITables v2.3.0 from the init_notebook_mode cell...
(need help?)
Maximum Drawdown for TEAM
TEAM
Benchmark
Loading ITables v2.3.0 from the init_notebook_mode cell...
(need help?)
CTSH
COGNIZANT TECHNOLOGY SOLUTIONS CORP (Services-Computer Programming Services)
Fiscal year end : 1231 Report Date : 2024-12-31 Filing Date : 2025-02-12
COGNIZANT TECHNOLOGY SOLUTIONS CORPORATIONConsolidated Balance Sheets 2024 2023 2022 2021 2020
──────────────────────────────────────────────────────────────────────────────────────────────────────────────────────
Cash & Equivalents millions 2,231 2,621 2,191 1,792 2,680 Accounts Receivable millions 4,059 3,849 3,796 3,557 Total Current Assets millions 7,504 7,506 7,266 7,342 Property, Plant and Equipment millions 994 1,048 1,101 1,171 1,251 Goodwill millions 6,953 6,085 5,710 5,620 5,031 Other Assets millions 1,026 656 662 701 Total Assets millions 19,966 18,483 17,852 17,852 Accounts Payable millions 340 337 360 361 Total Current Liabilities millions 3,585 3,333 3,347 3,529 Long-term Liabilities millions 494 369 362 287 Total Liabilities millions 5,558 5,256 5,543 5,861 Commitments & Contingencies Common Stock millions 5 5 5 5 Retained Earnings millions 14,686 13,301 12,588 11,922 Other Comprehensive Income millions( 296)( 94)( 299) 37 Total Stockholders' Equity millions 14,408 13,227 12,309 11,991 10,836 Total Liabilities & Equity millions 19,966 18,483 17,852 17,852
COGNIZANT TECHNOLOGY SOLUTIONS CORPORATIONIncome Statements 2024 2023 2022 2021 2020
──────────────────────────────────────────────────────────────────────────────────────────────────────────────────────────
Selling, General & Admin millions( 3,223)( 3,252)( 3,443)( 3,503)( 3,100) Operating Income millions 2,892 2,689 2,968 2,826 2,114Income Tax millions( 713)( 668)( 730)( 693)( 704)Net Income millions 2,240 2,126 2,290 2,137 1,392EPS Basic 4.52 4.21 4.42 4.06 2.58EPS Diluted 4.51 4.21 4.41 4.05 2.57Shares Basic millions 496 505 518 527 540Shares Diluted millions 497 505 519 528 541
COGNIZANT TECHNOLOGY SOLUTIONS CORPORATIONConsolidated Statement of Cash Flows 2024 2023 2022 2021 2020
──────────────────────────────────────────────────────────────────────────────────────────────────────────────────────────
Stock-based Compensation millions 175 176 261 246 232 Net Cash from Operations millions 2,124 2,330 2,568 2,495 3,299 Capital Expenditures millions( 297)( 317)( 332)( 279)( 398) Net Cash from Investing millions( 1,646)( 331)( 106)( 2,164)( 1,238) Stock Repurchases millions( 605)( 1,064)( 1,422)( 771)( 1,621) Net Cash from Financing millions( 915)( 1,609)( 1,939)( 1,203)( 2,009)Net Change in Cash millions( 486) 423 502( 888) 35Total Cash and Equivalents millions 2,231 2,717 2,294 1,792 2,680Available durations for this statement:1 Month3 MonthsAnnual
Statistics for CTSH
Revenue
Net Income
Gross Margin %
Net Margin %
ROE %
ROA %
Loading ITables v2.3.0 from the init_notebook_mode cell...
(need help?)
Performance Details for CTSH
89
Loading ITables v2.3.0 from the init_notebook_mode cell...
(need help?)
Maximum Drawdown for CTSH
CTSH
Benchmark
Loading ITables v2.3.0 from the init_notebook_mode cell...
(need help?)
GFS
Performance Details for GFS
90
Loading ITables v2.3.0 from the init_notebook_mode cell...
(need help?)
Maximum Drawdown for GFS
GFS
Benchmark
Loading ITables v2.3.0 from the init_notebook_mode cell...
(need help?)
KLAC
KLA CORP (Optical Instruments & Lenses)
Fiscal year end : 0630 Report Date : 2024-06-30 Filing Date : 2024-08-05
KLA CORPConsolidated Balance Sheets 2024 2023 2022 2021
───────────────────────────────────────────────────────────────────────────────────────────────────────────────
Cash & Equivalents thousands 1,977,129 1,927,865 1,584,908 1,434,610 Accounts Receivable thousands 1,833,041 1,753,361 1,811,877 1,305,479 Inventory thousands 3,034,781 2,876,784 2,146,889 1,575,380 Total Current Assets thousands10,031,144 8,372,032 7,168,911 5,696,248 Property, Plant and Equipment thousands 1,109,968 1,031,841 849,929 663,027 Goodwill thousands 2,015,726 2,278,820 2,320,049 2,011,172 Other Assets thousands 692,723 637,462 484,612 444,905 Total Assets thousands15,433,56614,072,35712,597,08810,271,124 Accounts Payable thousands 359,487 371,026 443,338 342,083 Total Current Liabilities thousands 4,660,774 3,742,842 2,871,083 2,103,227 Long-term Liabilities thousands 743,115 813,058 882,642 631,290 Total Liabilities thousands12,065,23811,152,60411,197,998 6,895,482 Commitments & Contingencies Common Stock thousands 134 137 142 153 Retained Earnings thousands 1,137,270 848,431 366,882 1,277,123 Other Comprehensive Income thousands( 49,075)( 36,341)( 27,471)( 75,557) Total Stockholders' Equity thousands 3,368,328 2,919,753 1,401,351 3,377,554 Total Liabilities & Equity thousands15,433,56614,072,35712,597,08810,271,124
PACCAR IncConsolidated Statement of Cash Flows 2024 2023 2022 2021 2020
──────────────────────────────────────────────────────────────────────────────────────────────────────────────────
Inventories ( 425)( 3,507)( 2,727)( 6,280)( 519) Net Cash from Operations 46,409 41,900 30,270 21,867 29,872 Capital Expenditures ( 8,387)( 6,950)( 5,250)( 5,591)( 5,504) Net Cash from Investing ( 44,873)( 28,710)( 20,330)( 13,627)( 18,758) Stock Repurchases ( 45)( 35)( 21)( 15)( 421) Net Cash from Financing ( 1,231) 11,022 3,049( 8,829)( 18,085)Net Change in Cash ( 1,209) 24,908 12,626( 1,113)( 6,355)
Statistics for PCAR
Revenue
Net Income
Gross Margin %
Net Margin %
ROE %
ROA %
Loading ITables v2.3.0 from the init_notebook_mode cell...
(need help?)
Performance Details for PCAR
92
Loading ITables v2.3.0 from the init_notebook_mode cell...
(need help?)
Maximum Drawdown for PCAR
PCAR
Benchmark
Loading ITables v2.3.0 from the init_notebook_mode cell...
(need help?)
REGN
REGENERON PHARMACEUTICALS, INC. (Pharmaceutical Preparations)
Fiscal year end : 1231 Report Date : 2024-12-31 Filing Date : 2025-02-05
REGENERON PHARMACEUTICALS, INC.Consolidated Balance Sheets 2024 2023 2022 2021
──────────────────────────────────────────────────────────────────────────────────────────────────────
Cash & Equivalents 24,882 27,300 31,059 28,856 Accounts Receivable 62,119 56,673 53,287 60,365 Inventory 30,873 25,805 24,019 19,513 Total Current Assets 186,609 194,792 158,841 140,149 Other Assets 11,360 4,441 3,364 2,161 Total Assets 377,594 330,802 292,145 254,348 Accounts Payable 7,895 6,066 5,892 5,640 Total Current Liabilities 39,443 34,234 31,413 39,325 Long-term Liabilities 15,714 8,541 6,380 6,802 Total Liabilities 84,058 71,071 65,505 66,660 Commitments & Contingencies Common Stock 0 0 0 0 Retained Earnings 316,729 272,603 233,067 189,683 Other Comprehensive Income ( 79)( 809)( 2,388)( 262) Total Stockholders' Equity 293,536 259,731 226,640 187,688Total Liabilities & Equity 377,594 330,802 292,145 254,348
REGENERON PHARMACEUTICALS, INC.Income Statements 2024 2023 2022 2021 2020
──────────────────────────────────────────────────────────────────────────────────────────────────────────────────
Revenue 60,578 55,031 49,141 121,172 5,570 Research & Development 51,320 44,390 35,925 28,601 26,470 Selling, General & Admin 29,544 26,313 21,159 18,249 13,460 Cost of Sales Operating Income 39,907 40,471 47,389 89,468 35,766 Pre-tax Income 47,799 41,993 48,588 93,258 38,104 Income Tax ( 3,673)( 2,457)( 5,204)( 12,505)( 2,972) EPS Basic 40.9 37.05 40.51 76.4 32.65 EPS Diluted 38.34 34.77 38.22 71.97 30.52 Shares Basic 1,079 1,067 1,071 1,057 1,076 Shares Diluted 1,151 1,137 1,135 1,122 1,151 Net Income 44,126 39,536 43,384 80,753 35,132Available durations for this statement:6 MonthsAnnual
REGENERON PHARMACEUTICALS, INC.Consolidated Statement of Cash Flows
No data found for Consolidated Statement of Cash Flows
Statistics for REGN
Revenue
Net Income
Gross Margin %
Net Margin %
ROE %
ROA %
Loading ITables v2.3.0 from the init_notebook_mode cell...
(need help?)
Performance Details for REGN
93
Loading ITables v2.3.0 from the init_notebook_mode cell...
(need help?)
Maximum Drawdown for REGN
REGN
Benchmark
Loading ITables v2.3.0 from the init_notebook_mode cell...
(need help?)
CSCO
CISCO SYSTEMS, INC. (Computer Communications Equipment)
Fiscal year end : 0726 Report Date : 2024-07-27 Filing Date : 2024-09-05
CISCO SYSTEMS, INC.Consolidated Balance Sheets 2024 2023 2022 2021
──────────────────────────────────────────────────────────────────────────────────────────────────────────────
Cash & Equivalents millions 7,508 10,123 7,079 9,175 Accounts Receivable 67 59 66 58 Inventory millions 3,373 3,644 2,568 1,559 Total Current Assets millions 36,862 43,348 36,717 39,112 Property, Plant and Equipment millions 2,090 2,085 1,997 2,338 Goodwill millions 58,660 38,535 38,304 38,168 Other Assets millions 5,944 6,007 5,957 5,016 Total Assets millions 124,413 101,852 94,002 97,497 Accounts Payable millions 2,304 2,313 2,281 2,362 Total Current Liabilities millions 40,584 31,309 25,640 26,257 Long-term Liabilities millions 2,540 2,134 1,968 2,393 Total Liabilities millions 78,956 57,499 54,229 56,222 Commitments & Contingencies Retained Earnings millions 1,087 1,639( 1,319)( 654) Other Comprehensive Income millions( 1,430)( 1,575)( 1,622)( 417) Total Stockholders' Equity millions 45,457 44,353 39,773 41,275 Total Liabilities & Equity millions 124,413 101,852 94,002 97,497
CISCO SYSTEMS, INC.Income Statements 2024 2023 2022 2021 2020
──────────────────────────────────────────────────────────────────────────────────────────────────────────────────────────
Revenue millions 14,550 13,856 13,539 13,804 49,301 Cost of Sales millions( 4,636)( 4,655)( 4,495)( 13,300)( 17,618) Research & Development millions 7,983 7,551 6,774 6,549 6,347 Total Operating Expenses millions( 22,647)( 20,722)( 18,279)( 19,061)( 18,063)Operating Income millions 12,181 15,031 13,969 12,833 13,620Pre-tax Income millions 12,234 15,318 14,477 13,262 13,970Income Tax millions( 1,914)( 2,705)( 2,665)( 2,671)( 2,756)Net Income millions 10,320 12,613 11,812 10,591 11,214 EPS Basic 2.55 3.08 2.83 2.51 2.65 EPS Diluted 2.54 3.07 2.82 2.5 2.64 Shares Basic millions 4,043 4,093 4,170 4,222 4,236 Shares Diluted millions 4,062 4,105 4,192 4,236 4,254
CISCO SYSTEMS, INC.Consolidated Statement of Cash Flows 2024 2023 2022 2021 2020
──────────────────────────────────────────────────────────────────────────────────────────────────────────────────────────
Stock-based Compensation millions 3,074 2,353 1,886 1,761 1,569 Inventories millions( 275)( 1,069)( 1,030)( 244)( 84) Net Cash from Operations millions 10,880 19,886 13,226 15,454 15,426 Capital Expenditures millions( 670)( 849)( 477)( 692)( 770) Net Cash from Investing millions( 20,478)( 5,107) 1,553( 5,285) 3,500 Stock Repurchases millions( 5,787)( 4,293)( 7,689)( 2,877)( 2,659) Net Cash from Financing millions 6,844( 11,626)( 15,962)( 12,097)( 18,856)Net Change in Cash millions( 2,785) 3,048( 1,363)( 1,870) 40Total Cash and Equivalents millions 8,842 11,627 8,579 9,942 11,812Available durations for this statement:6 MonthsAnnual
Statistics for CSCO
Revenue
Net Income
Gross Margin %
Net Margin %
ROE %
ROA %
Loading ITables v2.3.0 from the init_notebook_mode cell...
(need help?)
Performance Details for CSCO
94
Loading ITables v2.3.0 from the init_notebook_mode cell...
(need help?)
Maximum Drawdown for CSCO
CSCO
Benchmark
Loading ITables v2.3.0 from the init_notebook_mode cell...
(need help?)
INTC
INTEL CORP (Semiconductors & Related Devices)
Fiscal year end : 1227 Report Date : 2024-12-28 Filing Date : 2025-01-31
INTEL CORPORATIONConsolidated Balance Sheets 2024 2023 2022 2021
──────────────────────────────────────────────────────────────────────────────────────────────────────────────
Accounts Receivable millions 3,478 3,402 4,133 9,457 Inventory millions 12,198 11,127 13,224 10,776 Total Current Assets millions 47,324 43,269 50,407 58,558 Goodwill millions 24,693 27,591 27,591 26,963 Other Assets millions 7,475 13,647 11,315 6,072 Total Assets millions 196,485 191,572 182,103 168,406 Accounts Payable millions 12,556 8,578 9,595 5,747 Total Current Liabilities millions 35,666 28,053 32,155 27,462 Long-term Liabilities millions 9,505 6,576 8,978 5,071 Commitments & Contingencies Other Comprehensive Income millions( 711)( 215)( 562)( 880) Retained Earnings millions 49,032 69,156 70,405 68,265 Total Stockholders' Equity millions 99,270 105,590 101,423 95,391 Total Liabilities & Equity millions 196,485 191,572 182,103 168,406 Property, Plant and Equipment millions 80,860 63,245
INTEL CORPORATIONIncome Statements 2024 2023 2022 2021 2020
──────────────────────────────────────────────────────────────────────────────────────────────────────────────────────────
Revenue millions 53,101 54,228 63,054 79,024 77,867Cost of Sales millions( 35,756)( 32,517)( 36,188)( 35,209)( 34,255)Research & Development millions 16,546 16,046 17,528 15,190 13,556Selling, General & Admin millions 5,507 5,634 7,002 6,543 6,180Total Operating Expenses millions( 29,023)( 21,618)( 24,532)( 24,359)( 19,934)Operating Income millions( 11,678) 93 2,334 19,456 23,678Pre-tax Income millions( 11,210) 762 7,768 21,703 25,078Income Tax millions( 8,023)( 913)( 249)( 1,835)( 4,179)Net Income millions( 18,756) 1,689 8,014 19,868 20,899EPS Basic ( 4.38) 0.4 1.95 4.89 4.98EPS Diluted ( 4.38) 0.4 1.94 4.86 4.94 Shares Basic millions 4,280 4,190 4,108 4,059 4,199 Shares Diluted millions 4,280 4,212 4,123 4,090 4,232
INTEL CORPORATIONConsolidated Statement of Cash Flows 2024 2023 2022 2021 2020
──────────────────────────────────────────────────────────────────────────────────────────────────────────────────────────
Total Cash and Equivalents millions 8,249 7,079 11,144 4,827 5,865 Stock-based Compensation 34 32 31 20 19 Inventories millions( 1,105)( 2,097)( 2,436)( 2,339)( 687) Net Cash from Operations millions 8,288 11,471 15,433 29,456 35,864 Capital Expenditures millions( 23,944)( 25,750)( 24,844)( 18,733)( 14,259) Net Cash from Investing millions( 18,256)( 24,041)( 10,231)( 24,283)( 21,524) Net Cash from Financing millions 11,138 8,505 1,115( 6,211)( 12,669)Net Change in Cash millions 1,170( 4,065) 6,317( 1,038) 1,671 Stock Repurchases millions -0 -0( 2,415)( 14,229)Available durations for this statement:3 MonthsAnnual
Statistics for INTC
Revenue
Net Income
Gross Margin %
Net Margin %
ROE %
ROA %
Loading ITables v2.3.0 from the init_notebook_mode cell...
(need help?)
Insights for INTC
ROE < 5.0%
Performance Details for INTC
95
Loading ITables v2.3.0 from the init_notebook_mode cell...
(need help?)
Maximum Drawdown for INTC
INTC
Benchmark
Loading ITables v2.3.0 from the init_notebook_mode cell...
(need help?)
VRTX
VERTEX PHARMACEUTICALS INC / MA (Pharmaceutical Preparations)
Fiscal year end : 1231 Report Date : 2024-12-31 Filing Date : 2025-02-13
VERTEX PHARMACEUTICALS INC / MAConsolidated Balance Sheets 2024 2023 2022 2021
────────────────────────────────────────────────────────────────────────────────────────────────
Cash & Equivalents 45,696 103,691 105,040 67,950 Accounts Receivable 16,094 15,634 14,422 11,368 Inventory 12,054 7,388 4,606 3,531 Total Current Assets 95,964 141,442 132,348 95,606 Goodwill 11 11 11 10 Other Assets 9,993 8,953 4,096 1,108 Total Assets 225,332 227,302 181,509 134,325 Accounts Payable 4,130 3,649 3,039 1,950 Total Current Liabilities 35,646 35,474 27,421 21,420 Long-term Liabilities 9,018 8,777 6,858 3,033 Total Liabilities 61,236 51,498 42,382 33,325 Commitments & Contingencies 0 0 0 0 Common Stock 26 26 26 25 Other Comprehensive Income 1,278( 143) 8 159 Retained Earnings 96,068 101,424 65,228 32,008 Total Stockholders' Equity 164,096 175,804 139,127 101,000 Total Liabilities & Equity 225,332 227,302 181,509 134,325
TAKE-TWO INTERACTIVE SOFTWARE, INC.Consolidated Statement of Cash Flows 2024 2023 2022 2021 2020
───────────────────────────────────────────────────────────────────────────────────────────────────────────────────────────
Stock-based Compensation 3,356 3,178 1,830 1,105 2,579 Net Cash from Operations ( 161) 11 2,580 9,123 6,857 Capital Expenditures ( 1,417)( 2,042)( 1,586)( 689)( 534) Net Cash from Investing ( 282)( 28,763) 1,392( 8,068) 40 Stock Repurchases -0 -0( 2,000) -0 -0 Net Cash from Financing ( 914) 19,303( 2,568)( 574)( 775)Net Change in Cash ( 1,326)( 9,608) 1,352 668 6,014Total Cash and Equivalents 11,020 12,346 21,954 20,602 19,934 Inventories thousands( 4,106)( 2,503)( 8,489)Available durations for this statement:1 MonthAnnual
Statistics for TTWO
Revenue
Net Income
Gross Margin %
Net Margin %
ROE %
ROA %
Loading ITables v2.3.0 from the init_notebook_mode cell...
(need help?)
Insights for TTWO
Net Debt/EBITDA above 3.5 (heavy leverage).
Performance Details for TTWO
97
Loading ITables v2.3.0 from the init_notebook_mode cell...
(need help?)
Maximum Drawdown for TTWO
TTWO
Benchmark
Loading ITables v2.3.0 from the init_notebook_mode cell...
(need help?)
TXN
TEXAS INSTRUMENTS INC (Semiconductors & Related Devices)
Fiscal year end : 1231 Report Date : 2024-12-31 Filing Date : 2025-02-14
TEXAS INSTRUMENTS INCORPORATEDConsolidated Balance Sheets 2024 2023 2022 2021
──────────────────────────────────────────────────────────────────────────────────────────────────────────────
Cash & Equivalents millions 3,200 2,964 3,050 4,631 Accounts Receivable millions 1,719 1,787 1,895 1,701 Inventory millions 4,527 3,999 2,757 1,910 Total Current Assets millions 15,026 15,122 14,021 13,685 Property, Plant and Equipment millions 11,347 9,999 6,876 5,141 Goodwill millions 4,362 4,362 4,362 4,362 Other Assets millions 3,348 1,712 1,135 748 Total Assets millions 35,509 32,348 27,207 24,676 Accounts Payable millions 820 802 851 571 Total Current Liabilities millions 3,643 3,320 2,985 2,569 Long-term Liabilities millions 1,954 1,336 1,226 1,367 Total Liabilities millions 18,606 15,451 12,630 11,343 Common Stock millions 1,741 1,741 1,741 1,741 Retained Earnings millions 52,262 52,283 50,353 45,919 Other Comprehensive Income millions( 140)( 205)( 254)( 157) Total Stockholders' Equity millions 16,903 16,897 14,577 13,333 Total Liabilities & Equity millions 35,509 32,348 27,207 24,676
TEXAS INSTRUMENTS INCORPORATEDIncome Statements 2024 2023 2022 2021 2020
──────────────────────────────────────────────────────────────────────────────────────────────────────────────────────────
Revenue millions 15,641 17,519 20,028 18,344 14,461Cost of Sales millions( 6,547)( 6,500)( 6,257)( 5,968)Research & Development millions( 1,959)( 1,863)( 1,670)( 1,554)( 1,530)Selling, General & Admin millions( 1,794)( 1,825)( 1,704)( 1,666)( 1,623)Operating Income millions 5,465 7,331 10,140 8,960 5,894Pre-tax Income millions 5,453 7,418 10,032 8,919 6,017Income Tax millions( 654)( 908)( 1,283)( 1,150)( 422) EPS Basic 5.24 7.13 9.51 8.38 6.05 EPS Diluted 5.2 7.07 9.41 8.26 5.97 Shares Basic millions 912 908 916 923 921 Shares Diluted millions 919 916 926 936 933Net Income millions 4,799 6,510 8,749 7,769 5,595
TEXAS INSTRUMENTS INCORPORATEDConsolidated Statement of Cash Flows 2024 2023 2022 2021 2020
──────────────────────────────────────────────────────────────────────────────────────────────────────────────────────────
Stock-based Compensation millions 387 362 289 230 224 Inventories millions( 528)( 1,242)( 847)( 45)( 46) Net Cash from Operations millions 6,318 6,420 8,720 8,756 6,139 Capital Expenditures millions( 4,820)( 5,071)( 2,797)( 2,462)( 649) Net Cash from Investing millions( 3,202)( 4,362)( 3,583)( 4,095)( 922) Stock Repurchases millions( 929)( 293)( 3,615)( 527)( 2,553) Net Cash from Financing millions( 2,880)( 2,144)( 6,718)( 3,137)( 4,547)Net Change in Cash millions 236( 86)( 1,581) 1,524 670Total Cash and Equivalents millions 3,200 2,964 3,050 4,631 3,107Available durations for this statement:1 MonthAnnual
Statistics for TXN
Revenue
Net Income
Gross Margin %
Net Margin %
ROE %
ROA %
Loading ITables v2.3.0 from the init_notebook_mode cell...
(need help?)
Performance Details for TXN
98
Loading ITables v2.3.0 from the init_notebook_mode cell...
(need help?)
Maximum Drawdown for TXN
TXN
Benchmark
Loading ITables v2.3.0 from the init_notebook_mode cell...
(need help?)
MSTR
MICROSTRATEGY Inc (Finance Services)
Fiscal year end : 1231 Report Date : 2024-12-31 Filing Date : 2025-02-18
MICROSTRATEGY INCORPORATEDConsolidated Balance Sheets 2024 2023 2022 2021
─────────────────────────────────────────────────────────────────────────────────────────────────────────────────
Cash & Equivalents thousands 38,117 46,817 43,835 63,356 Accounts Receivable thousands 181,203 183,815 189,280 189,280 Total Current Assets thousands 252,324 267,895 264,566 267,965 Property, Plant and Equipment thousands 26,327 28,941 32,311 36,587 Total Assets thousands 25,843,685 4,762,528 2,410,272 3,557,124 Total Current Liabilities thousands 355,384 323,273 317,403 311,985 Long-term Liabilities thousands 5,379 22,208 17,124 26,224 Total Liabilities thousands 7,613,701 2,597,556 2,793,392 2,578,166 Commitments & Contingencies Common Stock thousands 18 18 Other Comprehensive Income thousands ( 15,384)( 11,444) ( 13,801)( 7,543) Retained Earnings thousands(2,166,876)( 999,234)(1,428,355) 41,442 Total Stockholders' Equity thousands 2,164,972 ( 383,120) Total Liabilities & Equity thousands 25,843,685 4,762,528 2,410,272 3,557,124